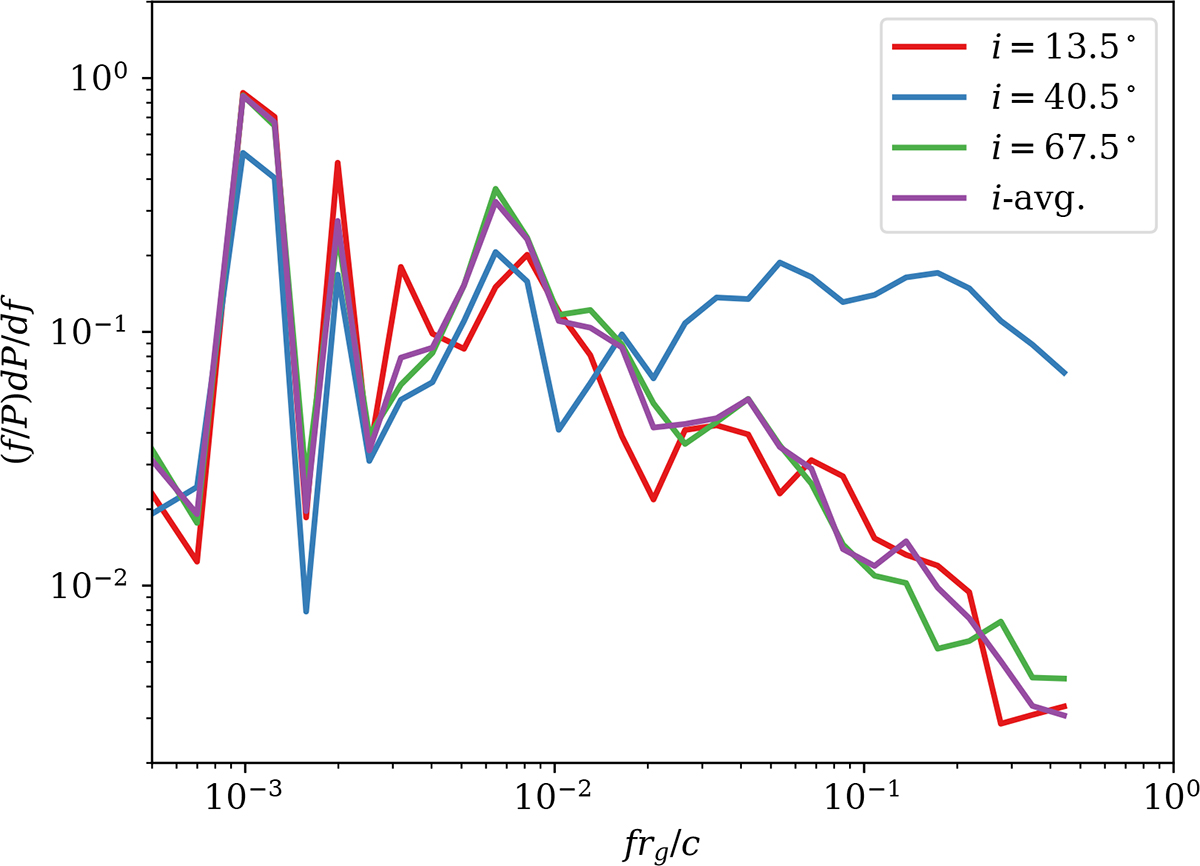
Fig. 11.
Download original image
Power spectral densities (PSDs), dP/df, for observers at different inclinations i. These PSDs are calculated from the light curves in Fig. 10, including the one averaged over all inclination angles. Each PSD is compensated by f, which shows the spectral power per logarithmic frequency interval, and normalized by P ≡ ∫0∞dP/df df.
Current usage metrics show cumulative count of Article Views (full-text article views including HTML views, PDF and ePub downloads, according to the available data) and Abstracts Views on Vision4Press platform.
Data correspond to usage on the plateform after 2015. The current usage metrics is available 48-96 hours after online publication and is updated daily on week days.
Initial download of the metrics may take a while.