Fig. A.1.
Download original image
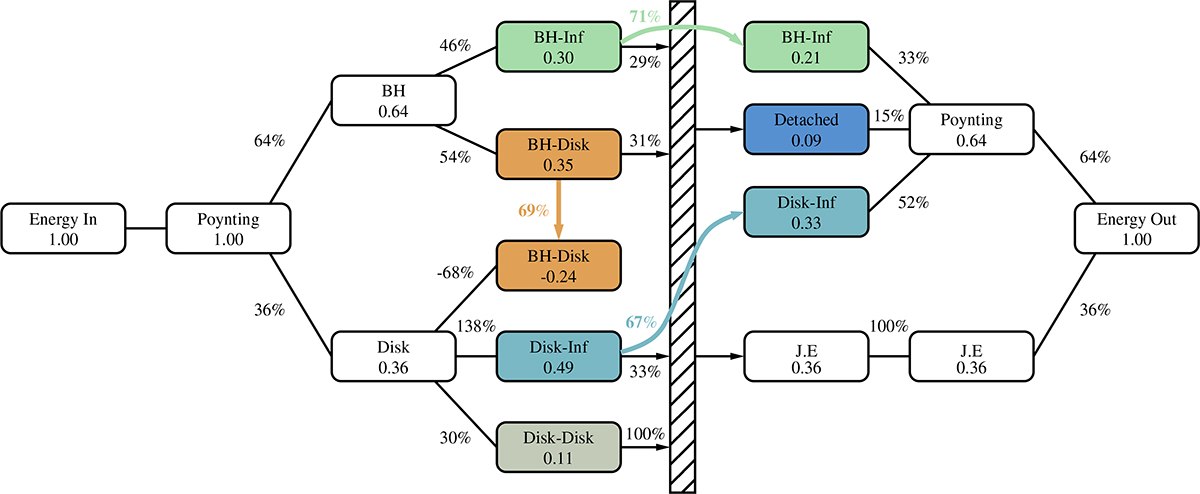
In each box, averages – taken over 200 ≤ ct/rg ≤ 3200 – of contributions to Poynting’s theorem expressed as a fraction of the total input Poynting flux, ![]() (cf. Table 1). Energy sources are on the left of the central hatched bar; energy sinks are on its right. The decomposition becomes more fine-grained toward the middle. Percentages indicate branching ratios between granularity levels. For example, from the BH-Inf box and its connection to the Poynting box on the energy sink side, one reads
(cf. Table 1). Energy sources are on the left of the central hatched bar; energy sinks are on its right. The decomposition becomes more fine-grained toward the middle. Percentages indicate branching ratios between granularity levels. For example, from the BH-Inf box and its connection to the Poynting box on the energy sink side, one reads ![]() ). The sum of values in every column equals unity to within percent-level error, as required for energy conservation. We exclude contributions from BH-BH field lines and the rate-of-change of the electromagnetic field energy (
). The sum of values in every column equals unity to within percent-level error, as required for energy conservation. We exclude contributions from BH-BH field lines and the rate-of-change of the electromagnetic field energy (![]() ) because these vanish at the percent level. Except in the cases of colored arrows crossing the hatched bar, it is not possible to determine branching ratios from an arbitrary source to an arbitrary sink. To represent this, black arrow-connections to the hatched bar indicate a sink-ambiguous deposit to (for the energy sources), or a source-ambiguous withdrawal from (for the energy sinks), the available energy budget.
) because these vanish at the percent level. Except in the cases of colored arrows crossing the hatched bar, it is not possible to determine branching ratios from an arbitrary source to an arbitrary sink. To represent this, black arrow-connections to the hatched bar indicate a sink-ambiguous deposit to (for the energy sources), or a source-ambiguous withdrawal from (for the energy sinks), the available energy budget.
Current usage metrics show cumulative count of Article Views (full-text article views including HTML views, PDF and ePub downloads, according to the available data) and Abstracts Views on Vision4Press platform.
Data correspond to usage on the plateform after 2015. The current usage metrics is available 48-96 hours after online publication and is updated daily on week days.
Initial download of the metrics may take a while.