Fig. 7.
Download original image
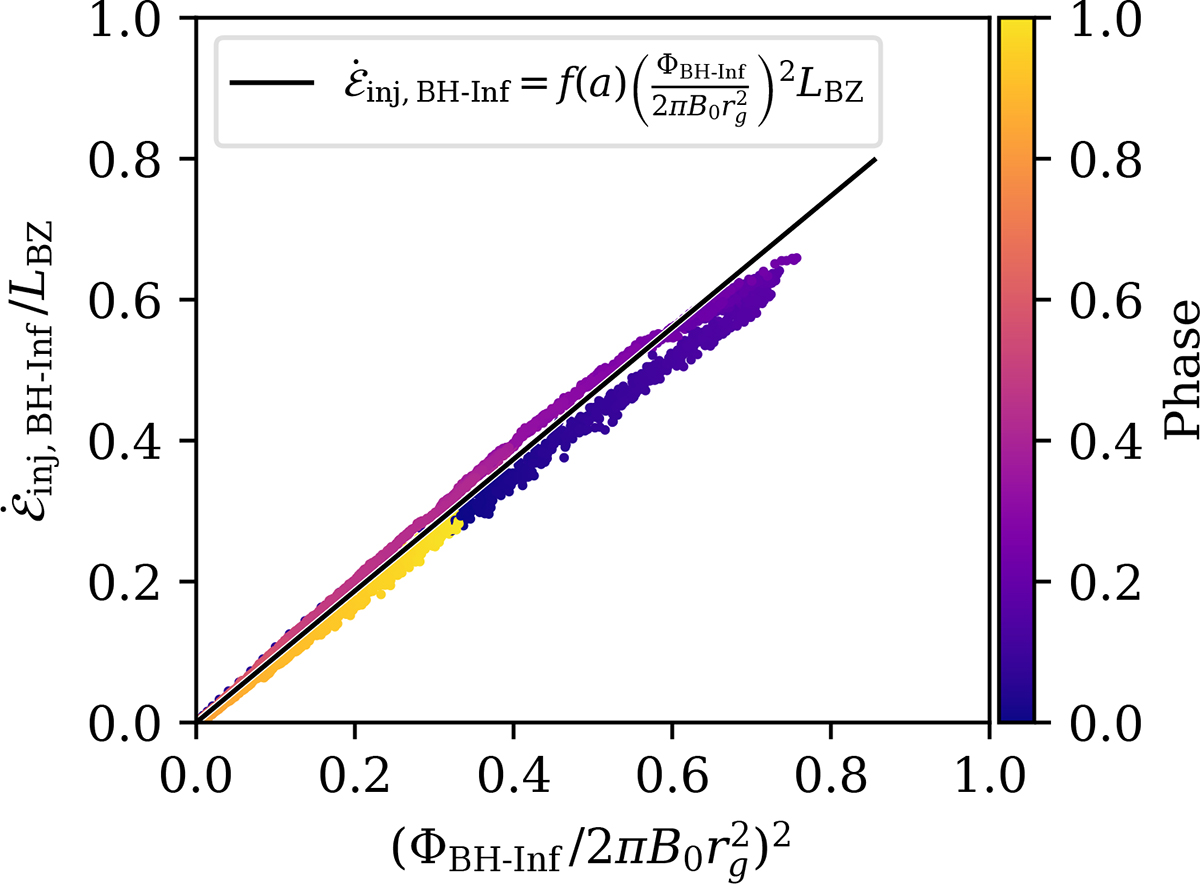
Injected Poynting power versus magnetic flux carried by open field lines threading the BH. Each data point represents one snapshot of the simulation. Color indicates time phase-folded on the loop advection and ejection period, 1000rg/c. The expected correlation, explained in the text, is drawn in black with f(a) evaluated as f(0.99) = 0.93.
Current usage metrics show cumulative count of Article Views (full-text article views including HTML views, PDF and ePub downloads, according to the available data) and Abstracts Views on Vision4Press platform.
Data correspond to usage on the plateform after 2015. The current usage metrics is available 48-96 hours after online publication and is updated daily on week days.
Initial download of the metrics may take a while.