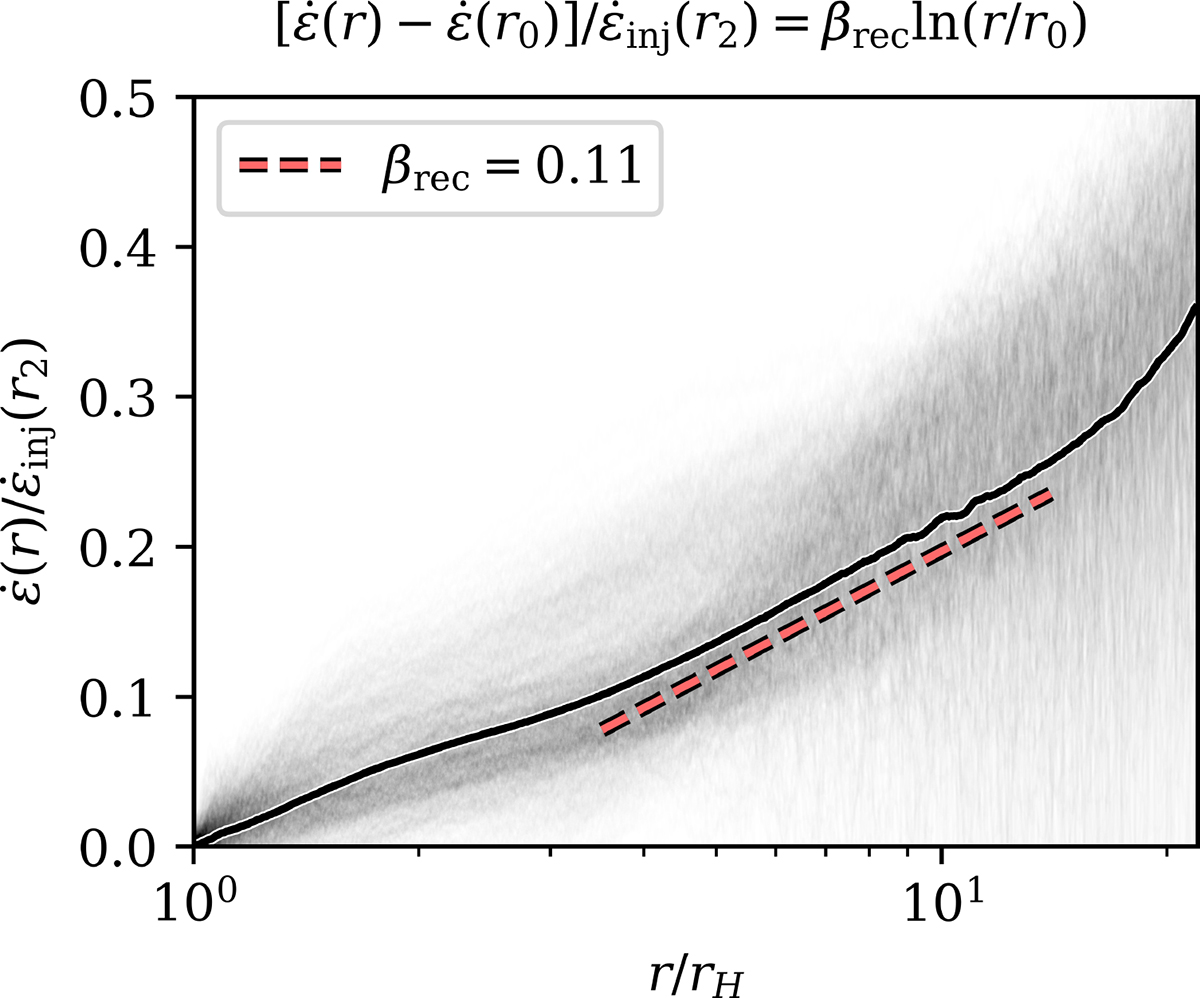
Fig. 8.
Download original image
Dissipation profiles computed according to Eq. (20). Instantaneous profiles are faint black lines; the time-averaged (over 200 ≤ ct/rg ≤ 3200) profile is a thick black line. We fit Eq. (28), with βrec a free parameter, to the time-averaged profile between r = r0 = 4rg and r = 16rg. The fit is drawn as a dashed red line between r = 4rg and r = 16rg with a constant vertical offset for clarity.
Current usage metrics show cumulative count of Article Views (full-text article views including HTML views, PDF and ePub downloads, according to the available data) and Abstracts Views on Vision4Press platform.
Data correspond to usage on the plateform after 2015. The current usage metrics is available 48-96 hours after online publication and is updated daily on week days.
Initial download of the metrics may take a while.