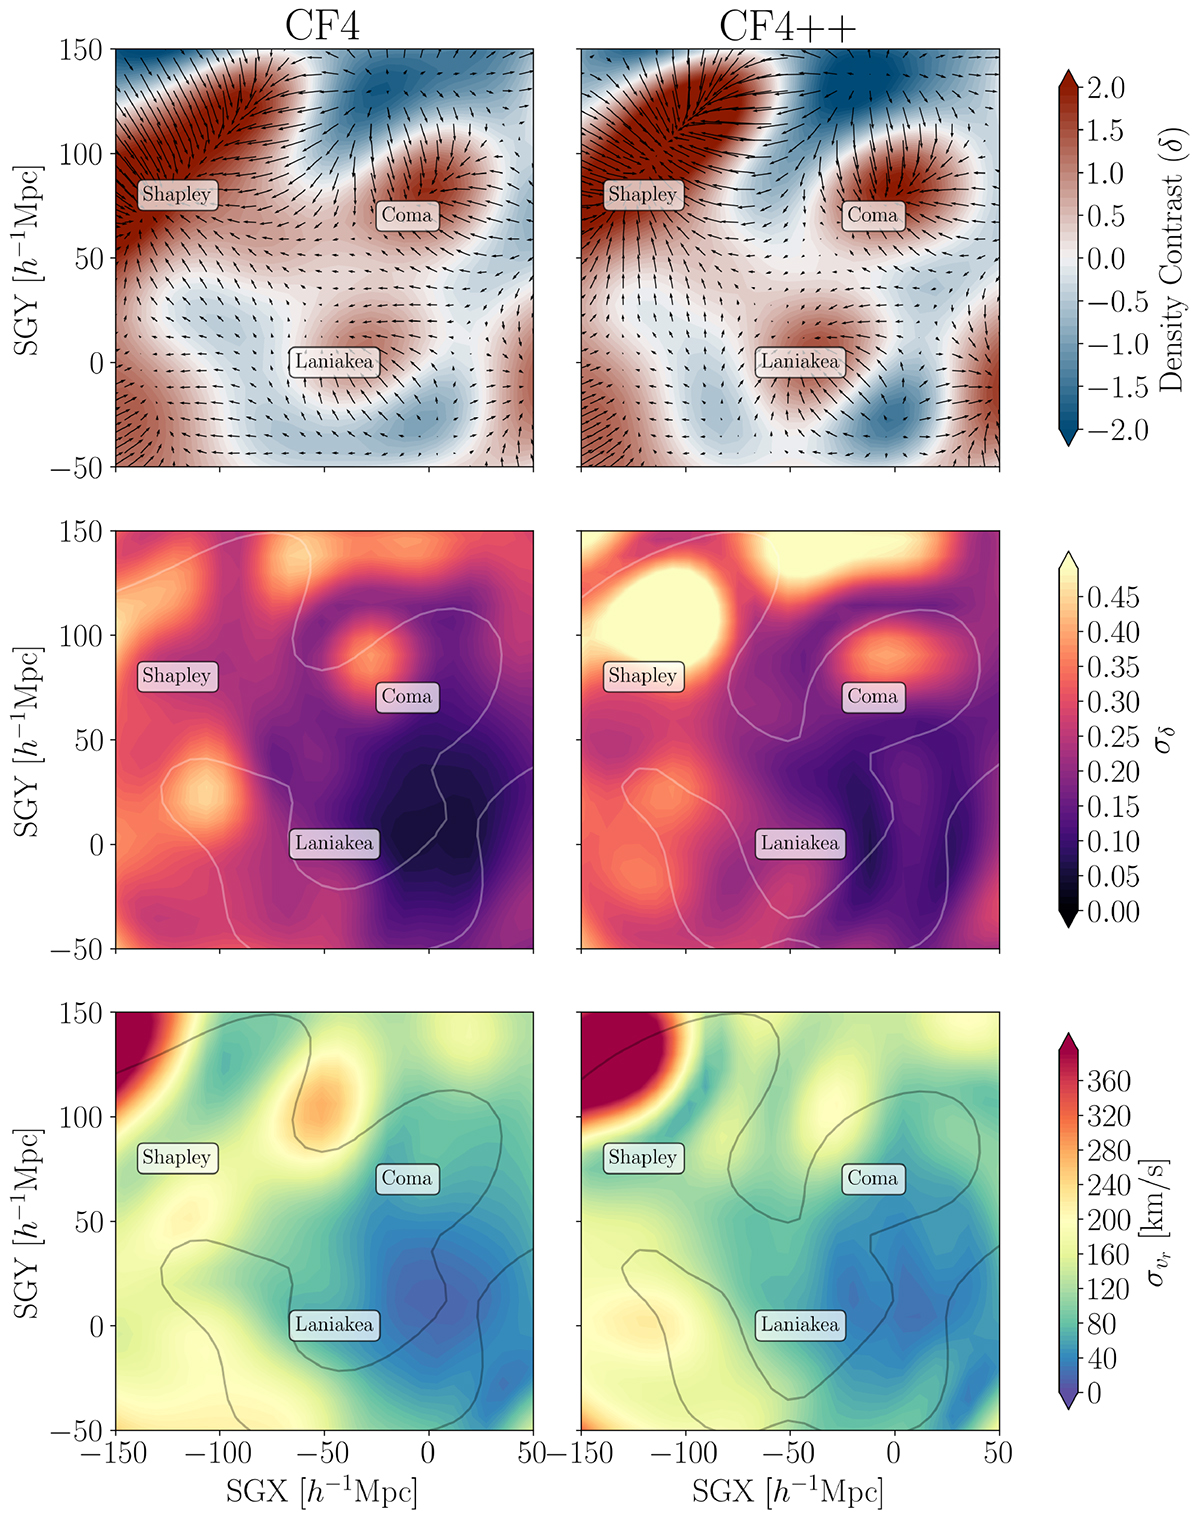
Fig. 5.
Download original image
Local cosmography of CF4 (left) and CF4++ (right) centred on SGZ = −3.9 h−1 Mpc, averaged over a total width of 24.3 h−1 Mpc. The first row shows the mean of the HMC realization density contrast (δ) and is overplotted by the mean radial velocity field. The second and third row respectively show the standard deviation of the density contrast fields and the radial velocity fields. The grey contours overplotted on these slices are the equivalent contours lines, where δ = 0.
Current usage metrics show cumulative count of Article Views (full-text article views including HTML views, PDF and ePub downloads, according to the available data) and Abstracts Views on Vision4Press platform.
Data correspond to usage on the plateform after 2015. The current usage metrics is available 48-96 hours after online publication and is updated daily on week days.
Initial download of the metrics may take a while.