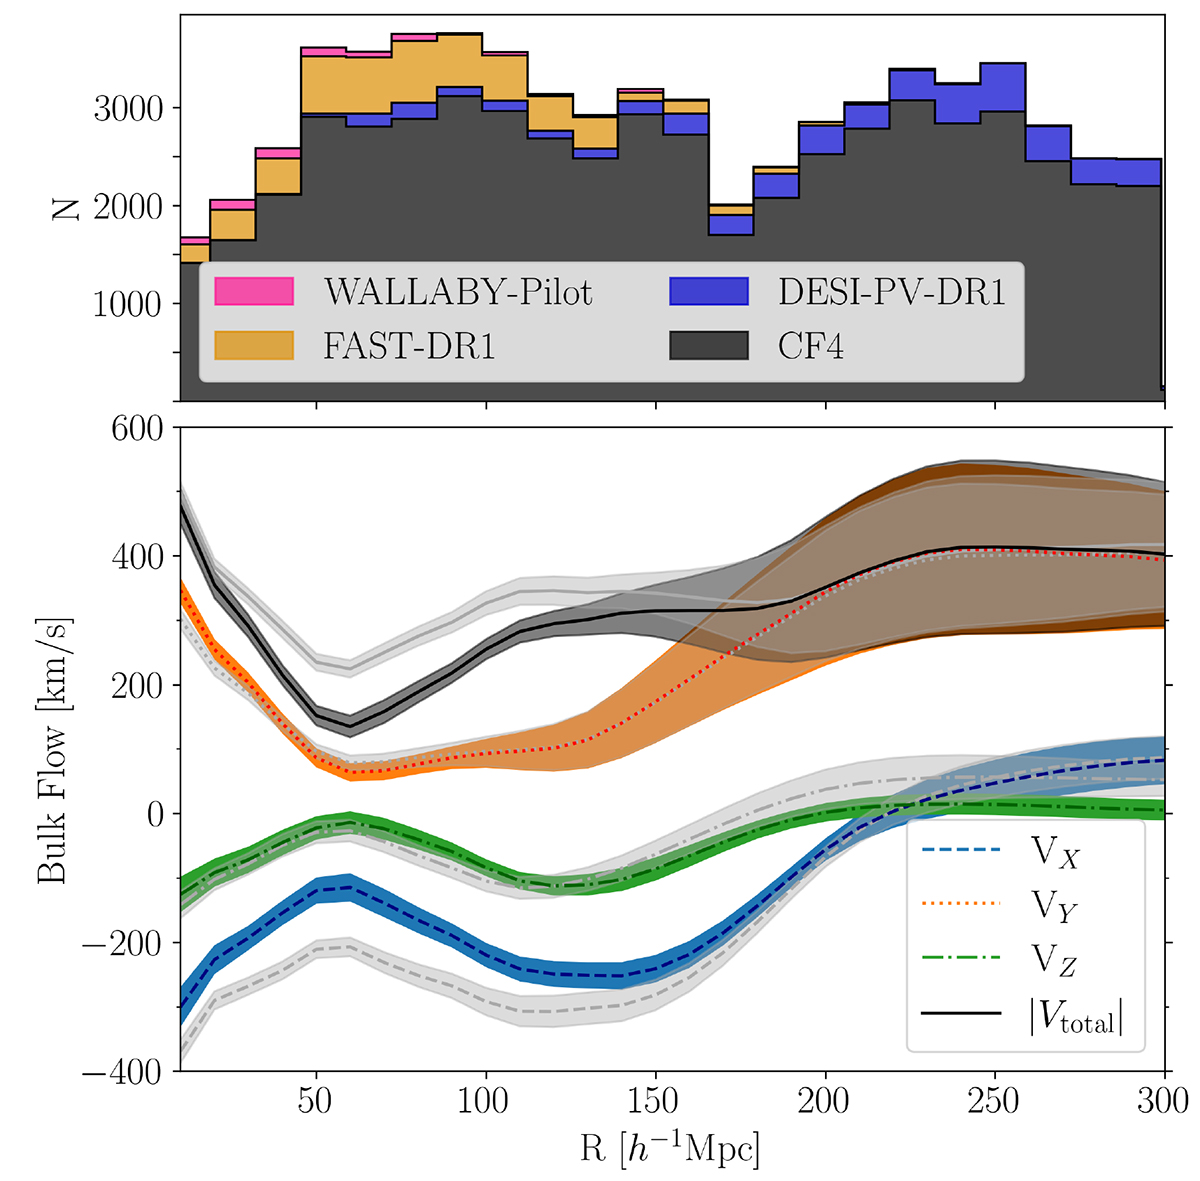
Fig. 8.
Download original image
Top: Stacked histogram showing the radial distribution of the galaxies composing the CF4++ dataset. Bottom: Mean bulk flow components along the supergalactic X- (dashed), Y- (dotted), and Z- (dash-dotted) axes and the total bulk flow (solid), as a function of distance from the observer’s location. The coloured bands show the CF4++ results, while the light grey bands show the CF4 measurements. The mean and standard deviation (transparent bands) are calculated using the nearly 10 000 HMC realizations.
Current usage metrics show cumulative count of Article Views (full-text article views including HTML views, PDF and ePub downloads, according to the available data) and Abstracts Views on Vision4Press platform.
Data correspond to usage on the plateform after 2015. The current usage metrics is available 48-96 hours after online publication and is updated daily on week days.
Initial download of the metrics may take a while.