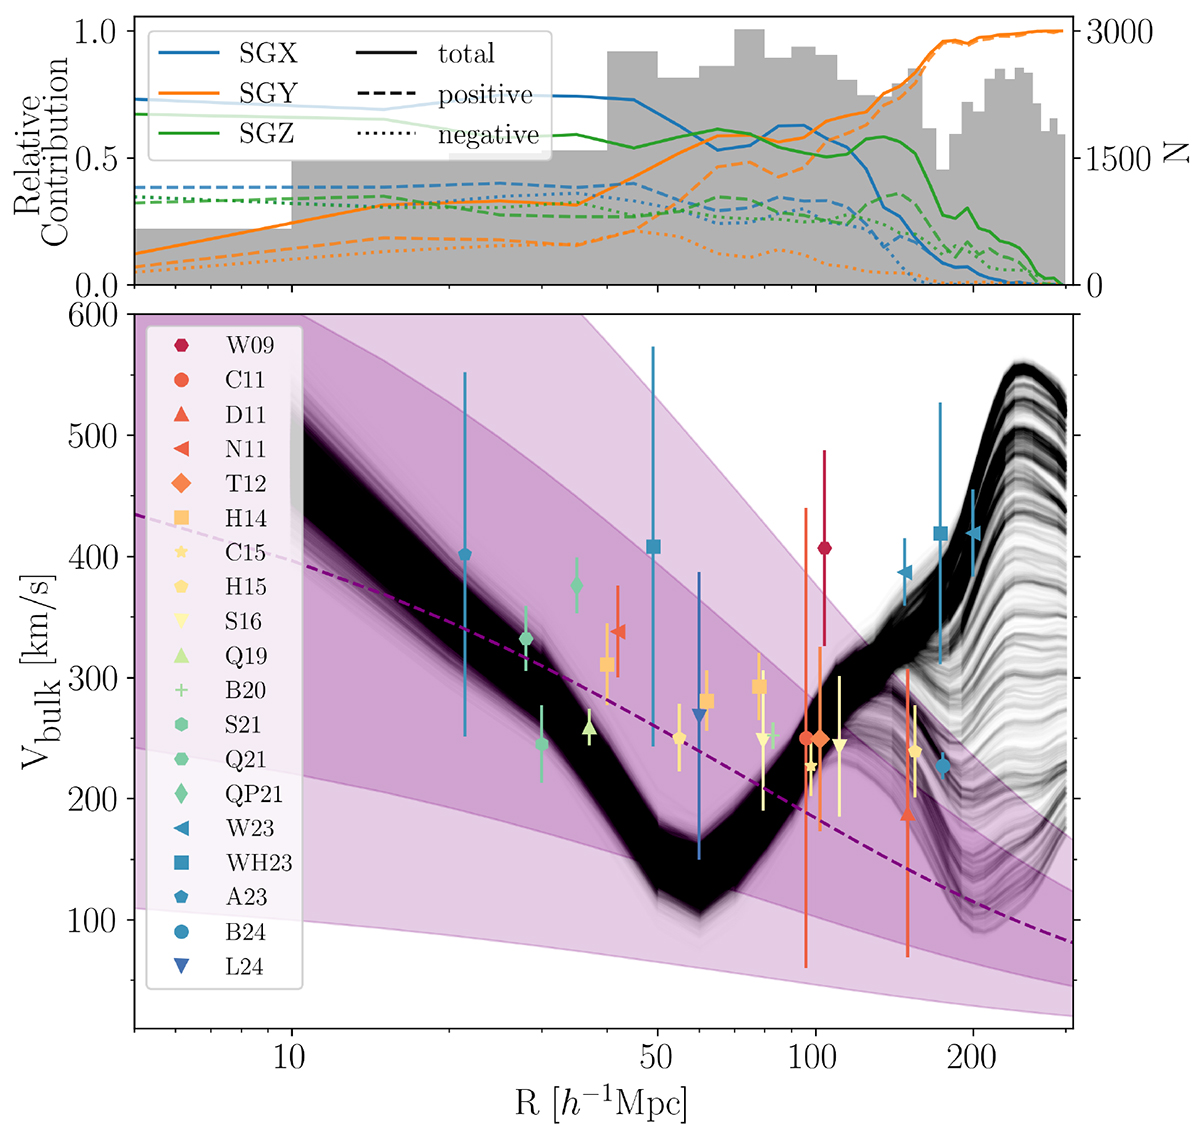
Fig. 9.
Download original image
Top: Relative contribution (square root of the fractional contribution) of each supergalactic Cartesian coordinate to the overall CF++ radial distribution. The solid (dashed, dotted) lines show the absolute total (positive, negative); the histogram shows the total number of galaxies in bins of 10 h−1 Mpc. Bottom: Total bulk flow of each HMC CF4++ realization (black), as a function of distance. Overplotted are the Table 1 values assuming an effective radius corresponding to a spherical top-hat window function. The dashed curved line is the corresponding linear theory ΛCDM prediction assuming the Planck cosmology specified in Section 4.2. The light and dark regions represent the 1σ and 2σ confidence levels, respectively. Small offsets have been introduced in the cases of overlapping data points.
Current usage metrics show cumulative count of Article Views (full-text article views including HTML views, PDF and ePub downloads, according to the available data) and Abstracts Views on Vision4Press platform.
Data correspond to usage on the plateform after 2015. The current usage metrics is available 48-96 hours after online publication and is updated daily on week days.
Initial download of the metrics may take a while.