Fig. 1
Download original image
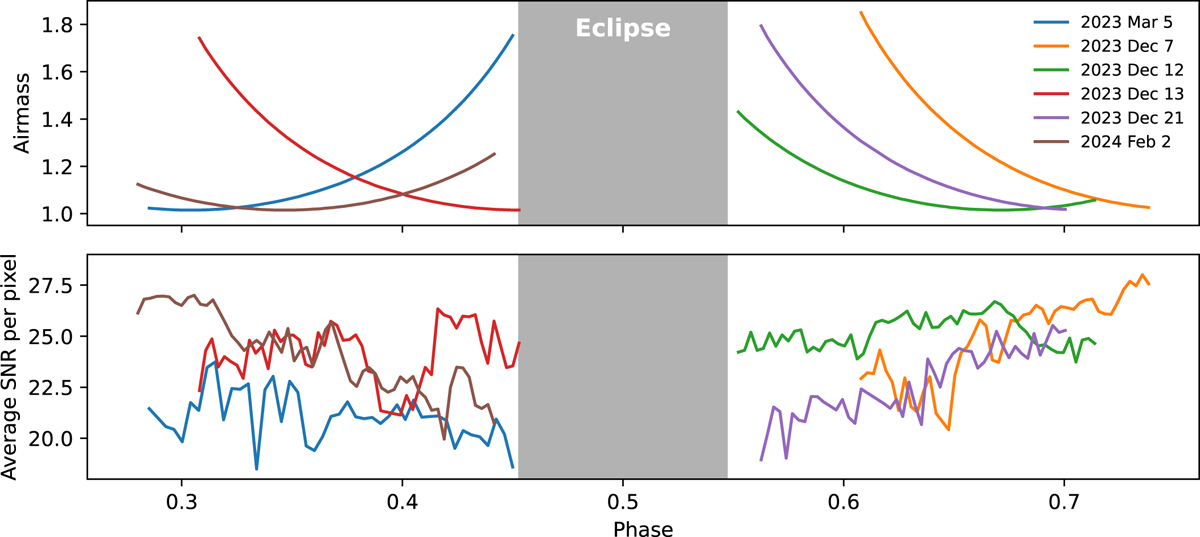
Summary of the observations of WASP-121 b. The top panel is the air mass as a function of phase for all observations. The bottom panel shows the S/N per pixel throughout the observations. The grey shaded area centred around phase 0.5 represents the phases where WASP-121 b is eclipsed by its host star. Of the six observations, three of them were obtained during the pre-eclipse phases (phases <0.5), while the other three are of the post-eclipse phases (phases >0.5).
Current usage metrics show cumulative count of Article Views (full-text article views including HTML views, PDF and ePub downloads, according to the available data) and Abstracts Views on Vision4Press platform.
Data correspond to usage on the plateform after 2015. The current usage metrics is available 48-96 hours after online publication and is updated daily on week days.
Initial download of the metrics may take a while.