Fig. B.1
Download original image
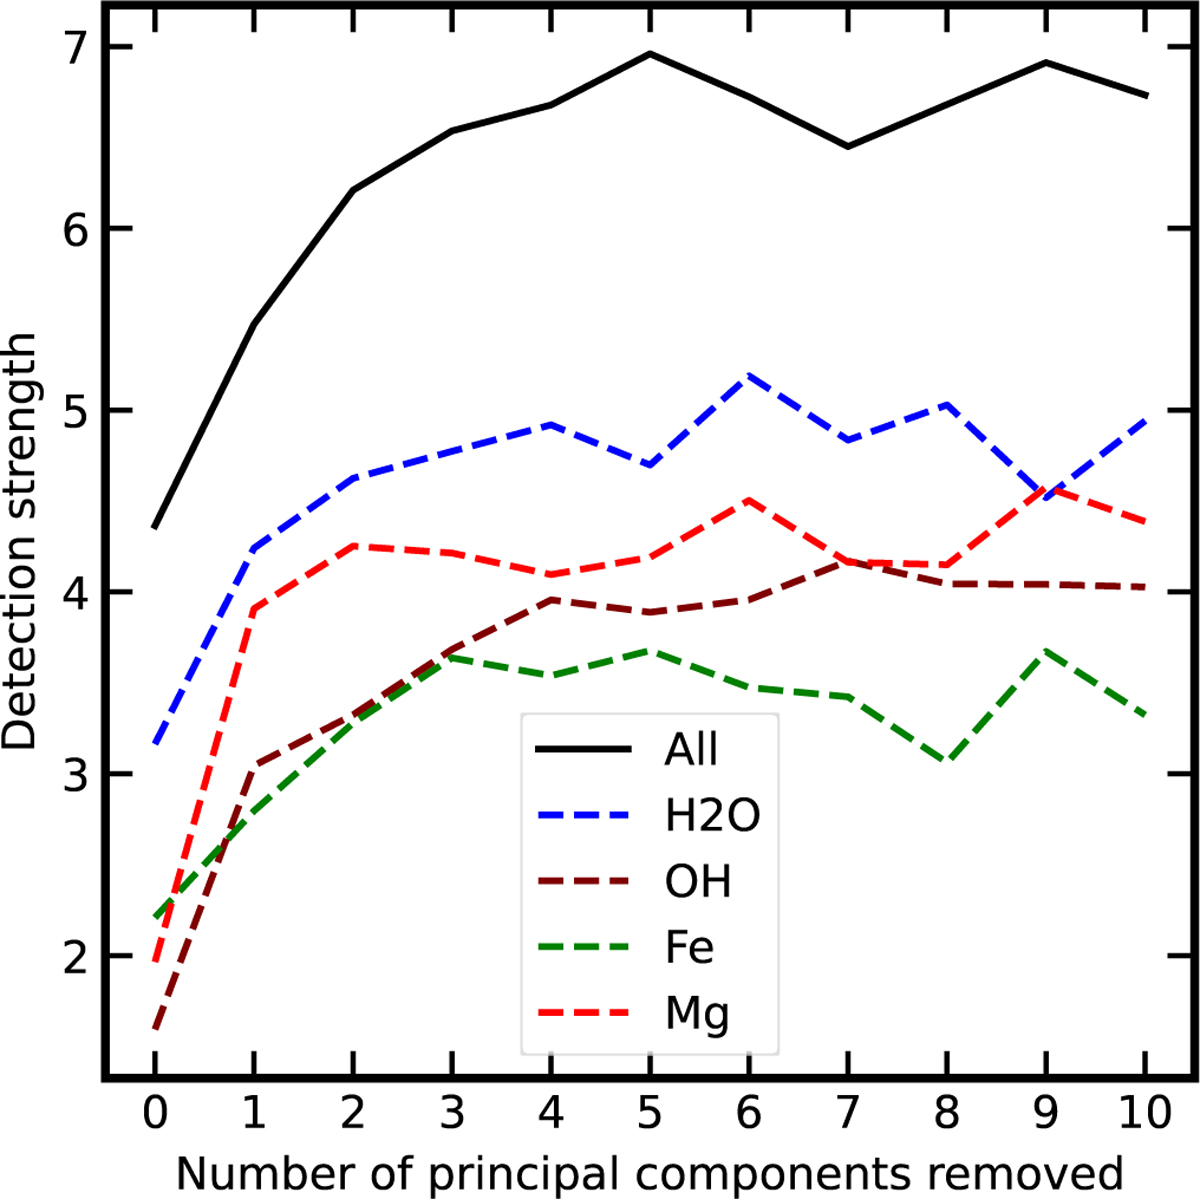
Evolution of signals strengths as a function of the number of principal components. Signal strengths are defined as the maximum in the cross-correlation signal-to-noise Kp-Vsys map in a 12 km s−1 by 12 km s−1 region centred on the expected velocity. This is done for an atmospheric model that includes all four species: H2O, OH, Fe and Mg (black solid line) as well as separately for each species (coloured dashed lines).
Current usage metrics show cumulative count of Article Views (full-text article views including HTML views, PDF and ePub downloads, according to the available data) and Abstracts Views on Vision4Press platform.
Data correspond to usage on the plateform after 2015. The current usage metrics is available 48-96 hours after online publication and is updated daily on week days.
Initial download of the metrics may take a while.