Open Access
Fig. B.2
Download original image
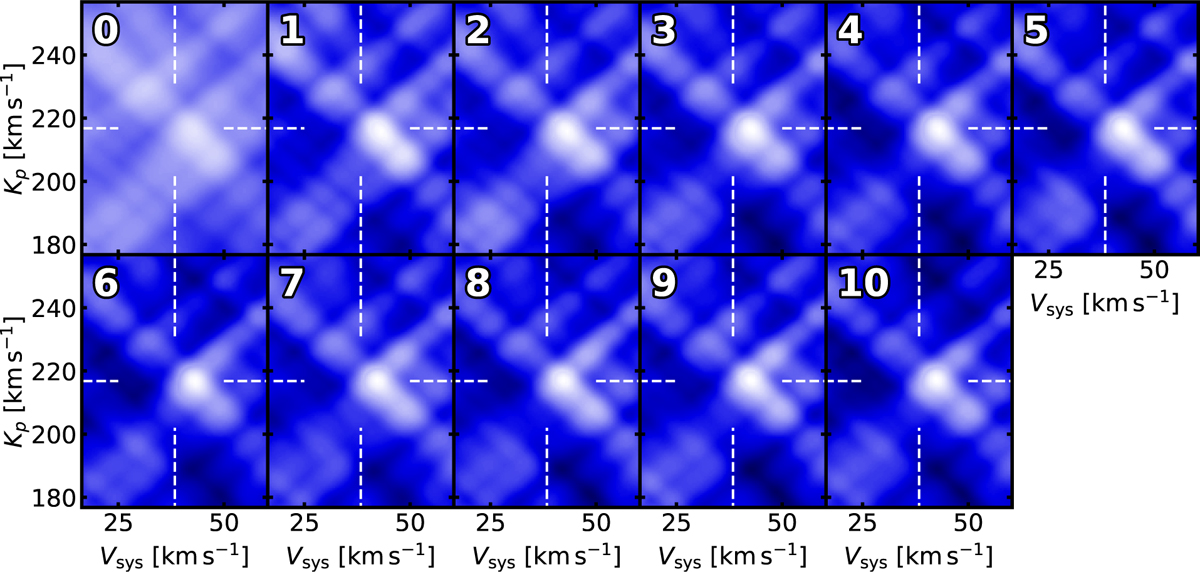
Cross-correlation signal-to-noise maps of H2O where we vary the number of principal components removed (top left number of each panel). The H2O signal position does not change significantly based on the number of components removed.
Current usage metrics show cumulative count of Article Views (full-text article views including HTML views, PDF and ePub downloads, according to the available data) and Abstracts Views on Vision4Press platform.
Data correspond to usage on the plateform after 2015. The current usage metrics is available 48-96 hours after online publication and is updated daily on week days.
Initial download of the metrics may take a while.