Fig. D.1
Download original image
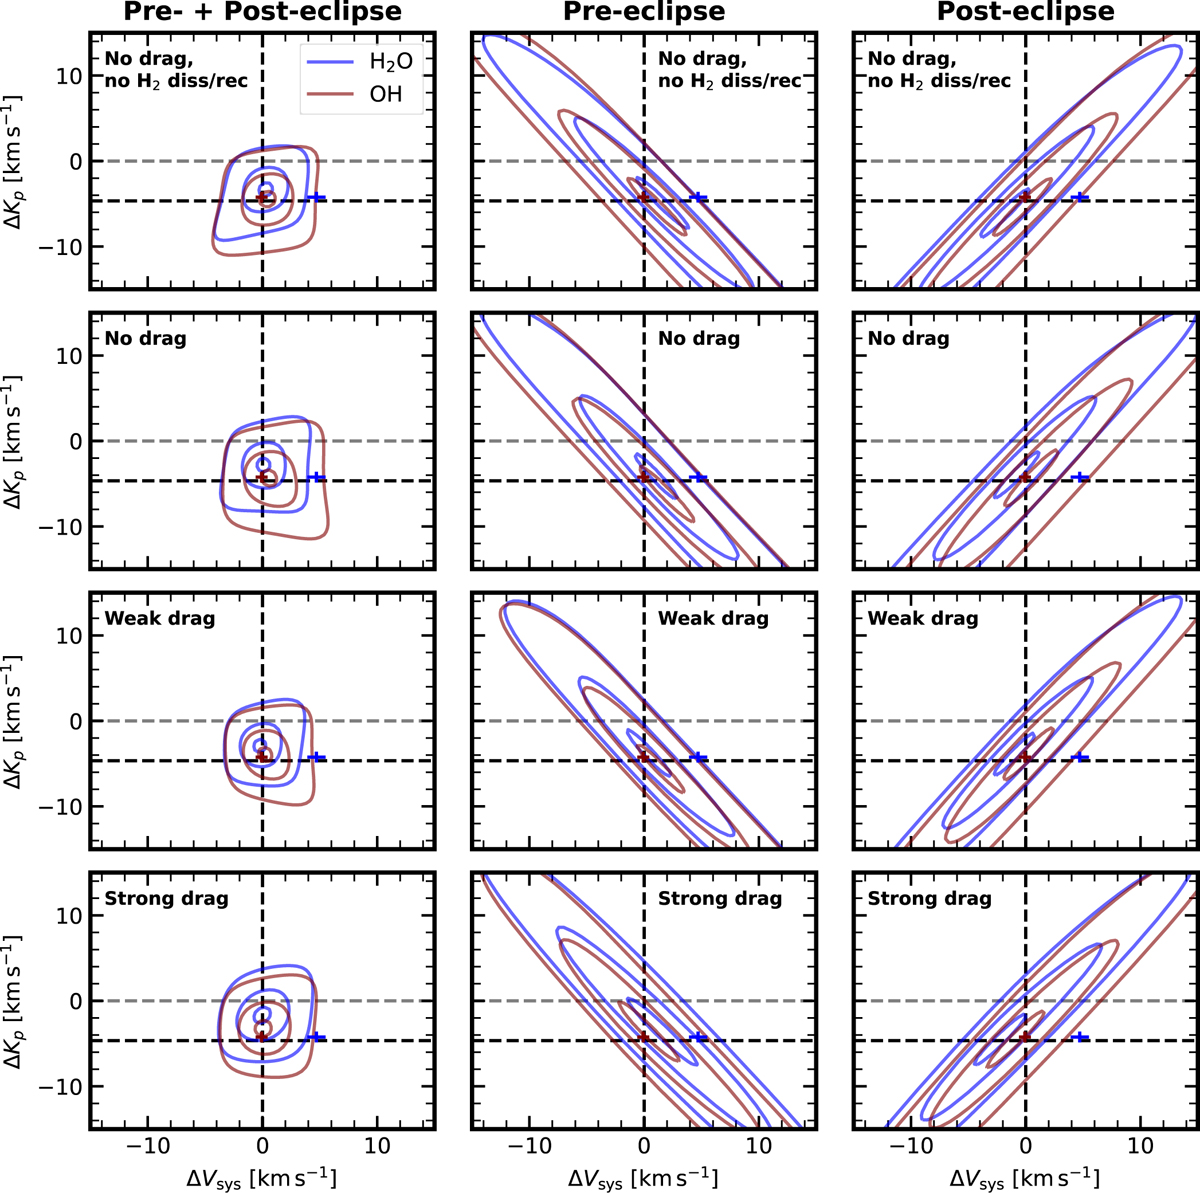
Same as Fig. 8 but for four different GMCs. The top row has models that has no drag and does not consider latent heat release from dissociation and recombination of H2 (Parmentier et al. 2018). The next three rows are maps of models that consider the dissociation and recombination of H2 (Tan et al. 2024). The difference comes in the drag timescale: τdrag = ∞ (no drag), τdrag = 106 s (weak drag), and τdrag = 104 s (strong drag). The left column maps consider both pre- and post-eclipse phases. The middle column includes the maps when considering only the pre-eclipse phases. In the right column are the maps of the post-eclipse phases only.
Current usage metrics show cumulative count of Article Views (full-text article views including HTML views, PDF and ePub downloads, according to the available data) and Abstracts Views on Vision4Press platform.
Data correspond to usage on the plateform after 2015. The current usage metrics is available 48-96 hours after online publication and is updated daily on week days.
Initial download of the metrics may take a while.