Fig. 2
Download original image
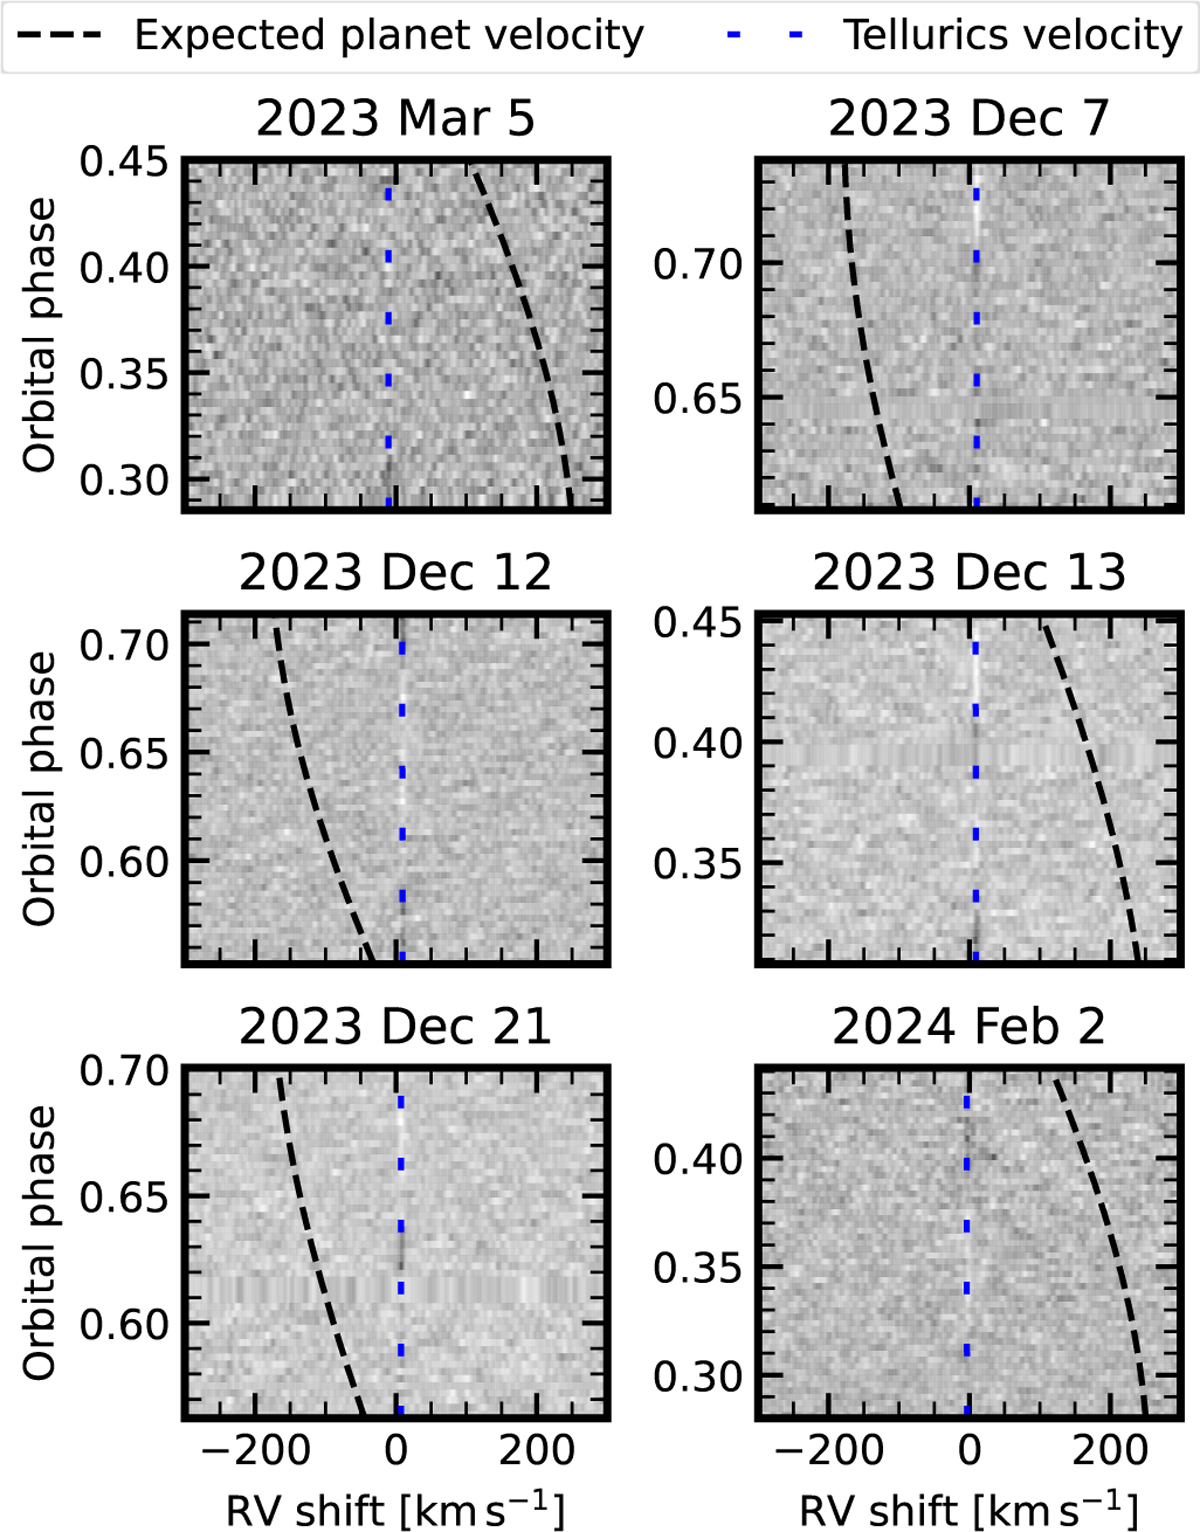
Cross-correlation function of each observation with an OH model (black-and-white colour map) along with the expected WASP-121 b velocities (black dashed line) compared to where tellurics are in velocity space (blue dotted line). The cross-correlation maps are shown in the BERV-corrected frame. In none of our observation nights do the planet velocities overlap with where the telluric are, lowering the risk that any remaining telluric residuals affect our results.
Current usage metrics show cumulative count of Article Views (full-text article views including HTML views, PDF and ePub downloads, according to the available data) and Abstracts Views on Vision4Press platform.
Data correspond to usage on the plateform after 2015. The current usage metrics is available 48-96 hours after online publication and is updated daily on week days.
Initial download of the metrics may take a while.