Fig. 6
Download original image
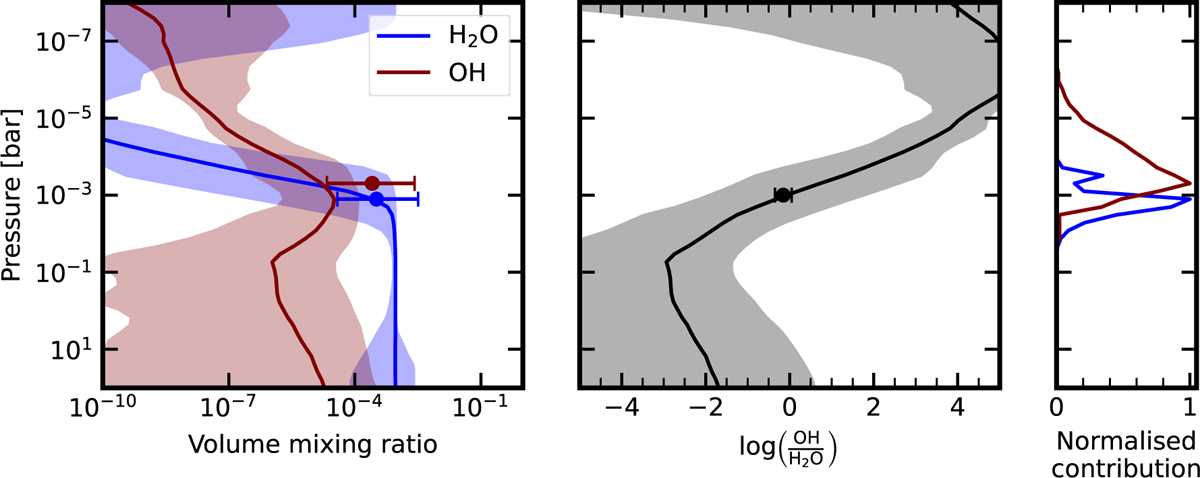
Comparison between retrieved molecular abundances and equilibrium predictions. We created models in chemical equilibrium using FastChem (Stock et al. 2022, 2018) with a five times solar metallicity composition and where the vertical temperature profile is sampled from the retrieval. In the left panel, the curves and the shaded areas represent the median and 1 σ uncertainties of the mixing ratios of H2O and OH from the equilibrium models. The points are the retrieved abundance for H2O and OH, with their y height at the approximate pressure that they probe. In the middle, the line and the shaded regions are the median and 1 σ uncertainties on the (base ten) log ratio of OH/H2O calculated from the equilibrium models. The point represent the log10(OH/H2O) calculated from the retrieval along with the associated 1 σ uncertainties. The point is at 1 mbar, which is the approximate pressure level where the observations probe. In the right panel, the contribution curves depict where in the atmosphere the signals of H2O (blue) and OH (maroon) are probed. Curves are normalised so that their maximum is equal to one.
Current usage metrics show cumulative count of Article Views (full-text article views including HTML views, PDF and ePub downloads, according to the available data) and Abstracts Views on Vision4Press platform.
Data correspond to usage on the plateform after 2015. The current usage metrics is available 48-96 hours after online publication and is updated daily on week days.
Initial download of the metrics may take a while.