Fig. 8
Download original image
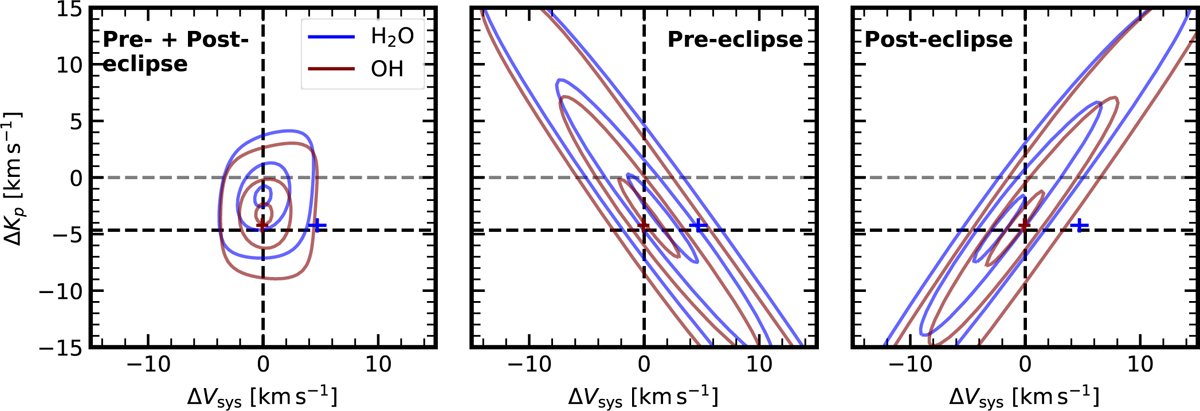
Contour plot of predicted Kp−Vsys maps by a WASP-121 b GCM. The model used is a strong drag model (τdrag = 104 s) based on the work of Tan et al. (2024). The black dashed lines at (ΔKp, ΔVsys) = (~−5, 0) km s−1 represent the planet position considering the rotation of the planet and assuming that the observed signal is uniform throughout the visible hemisphere. The grey line denotes the expected Kp without the rotation of the planet. The blue and maroon crosses are the retrieved velocities of H2O and OH, respectively, along with their 1 σ uncertainties. To get the contour lines, we first cross-correlate noiseless GCMs with molecular opacity templates, followed by a phase folding in the Kp−Vsys space. The contours represent an elevation of 0.99, 0.9 and 0.7 times the map maximum. The left panel is the resulting map from taking both the pre- and post-eclipse phases. The middle and right plot consider only the pre-eclipse and post-eclipse, respectively.
Current usage metrics show cumulative count of Article Views (full-text article views including HTML views, PDF and ePub downloads, according to the available data) and Abstracts Views on Vision4Press platform.
Data correspond to usage on the plateform after 2015. The current usage metrics is available 48-96 hours after online publication and is updated daily on week days.
Initial download of the metrics may take a while.