Fig. 1.
Download original image
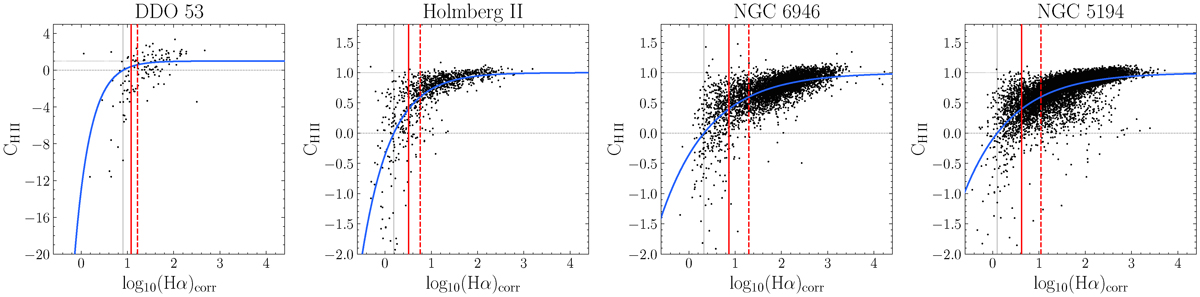
DIG models for individual galaxies. The fit is shown in blue, and the vertical red lines represent the Hα flux threshold for CH II < 0.4 (solid) and the flux threshold from Kaplan et al. (2016) (dashed). The vertical solid grey line shows log10(f0) and the horizontal dashed grey lines the median value of CH II for the 100 brightest and dimmest fibres. S/N > 3 for the used lines. The DIG models for the rest of the sample can be found in Appendix A.
Current usage metrics show cumulative count of Article Views (full-text article views including HTML views, PDF and ePub downloads, according to the available data) and Abstracts Views on Vision4Press platform.
Data correspond to usage on the plateform after 2015. The current usage metrics is available 48-96 hours after online publication and is updated daily on week days.
Initial download of the metrics may take a while.