Fig. 2.
Download original image
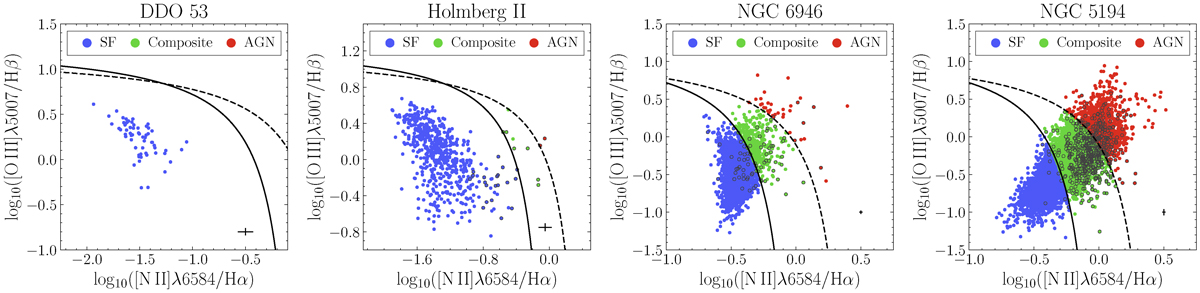
[N II] BPT diagrams for individual galaxies, with SF-like (in blue), composite (in green) and AGN-like (in red) characteristics. Black curves, solid and dashed, represent the borders between the different regions, as defined in Kauffmann et al. (2003) and Kewley et al. (2001). The mean error in both axis is represented as a cross in the bottom right corner area of each diagram. Only fibres with a S/N > 3 in all lines used are shown. Outlined points represent DIG fibres. The BPT diagrams for the rest of the sample can be found in Appendix C.
Current usage metrics show cumulative count of Article Views (full-text article views including HTML views, PDF and ePub downloads, according to the available data) and Abstracts Views on Vision4Press platform.
Data correspond to usage on the plateform after 2015. The current usage metrics is available 48-96 hours after online publication and is updated daily on week days.
Initial download of the metrics may take a while.