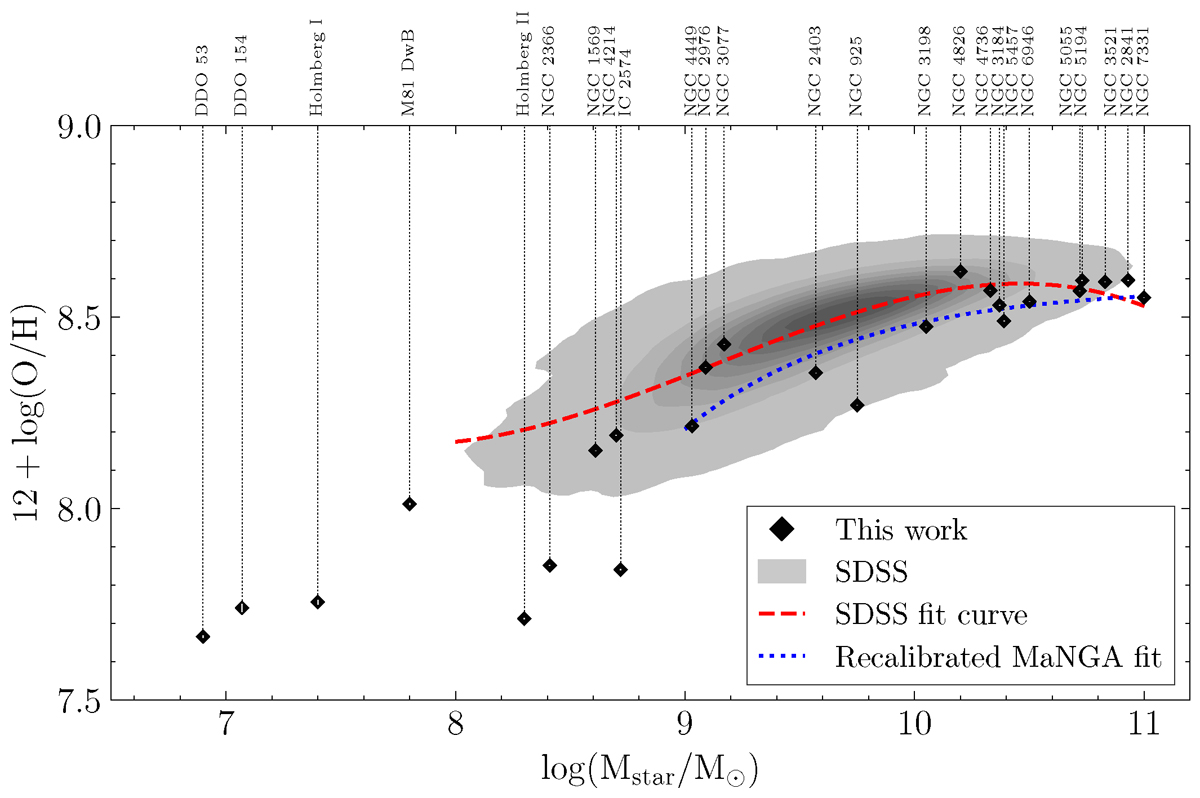
Fig. 3.
Download original image
Mass-metallicity relation of 69 830 SDSS galaxies (in the redshift range 0.04 < z < 0.2), shown with a kernel density estimate plot as the shaded region. Markers indicate galaxies in our sample. The dashed red line represents a third degree fit to SDSS data. The dotted blue line indicates the MMR calculated for the MaNGA survey (Barrera-Ballesteros et al. 2017) using the O3N2-M13 indicator (Marino et al. 2013), and recalibrated to the PG16 indicator (see Appendix E).
Current usage metrics show cumulative count of Article Views (full-text article views including HTML views, PDF and ePub downloads, according to the available data) and Abstracts Views on Vision4Press platform.
Data correspond to usage on the plateform after 2015. The current usage metrics is available 48-96 hours after online publication and is updated daily on week days.
Initial download of the metrics may take a while.