Fig. 5.
Download original image
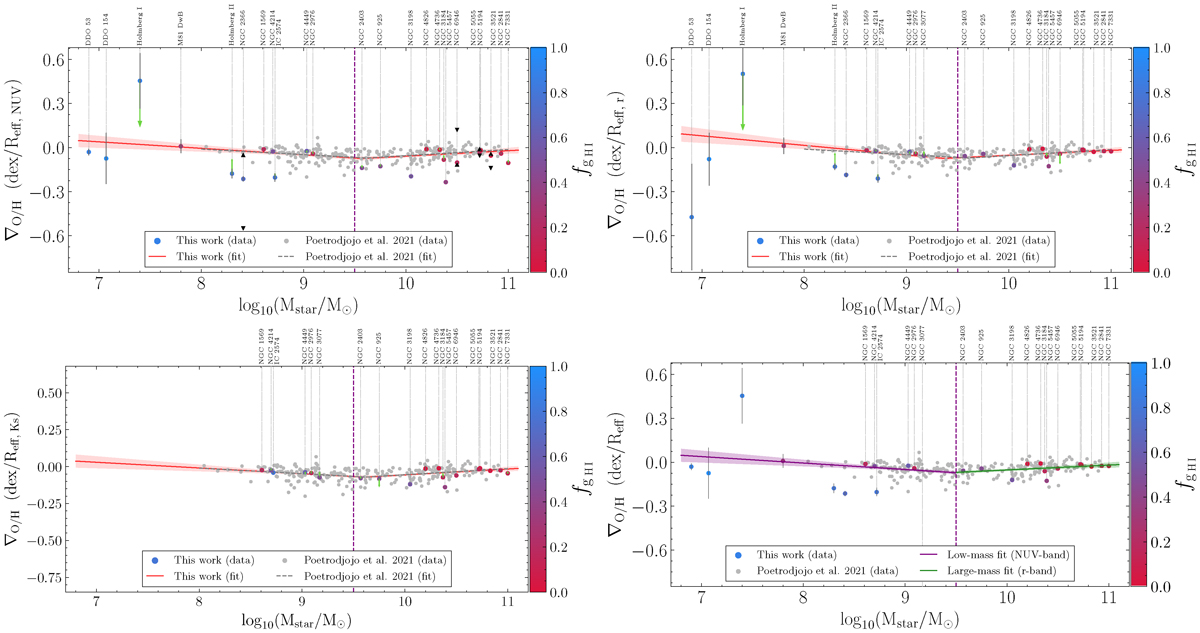
Relation between the stellar mass and the metallicity gradient using the NUV-band radius (top) and r-band radius (middle) and Ks-band (bottom) for normalisation. Coloured markers correspond to the sample of galaxies used in this study, and are coloured such that it represents the fraction of atomic gas of a given galaxy against the sum of the mass in stars and atomic gas, as it is indicated in the colour bar. Grey markers correspond to the gradients of galaxies studied in Poetrodjojo et al. (2021), calculated using PG16’s S calibration. The red line shows the piecewise linear fit to this data, which illustrates the tendencies of the gradients as mass increases. Green arrows show the deviation from values achieved using a DIG threshold of CH II > 0.6 as seen in Kaplan et al. (2016), when compared to our threshold of CH II > 0.4. The black triangles represent the values of the gradients in the first (pointing up) and second (pointing down) intervals of the piecewise linear functions for those galaxies fitted in that manner. Galaxies with stellar masses log(Mstar/M⊙)≳9.5 (dashed purple line) have on average disc-like morphologies (Simons et al. 2015).
Current usage metrics show cumulative count of Article Views (full-text article views including HTML views, PDF and ePub downloads, according to the available data) and Abstracts Views on Vision4Press platform.
Data correspond to usage on the plateform after 2015. The current usage metrics is available 48-96 hours after online publication and is updated daily on week days.
Initial download of the metrics may take a while.