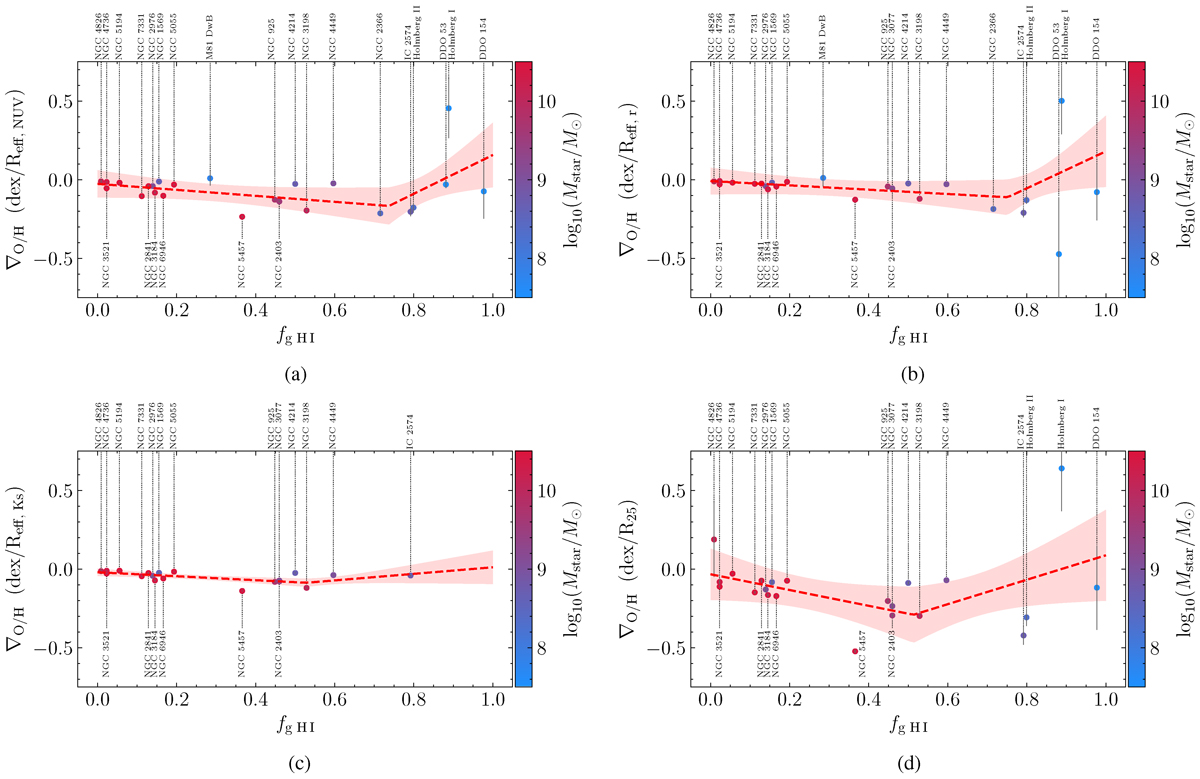
Fig. 6.
Download original image
Relation between metallicity gradients and fraction of atomic gas of a given galaxy against the sum of the mass in stars and atomic gas using all four available radii for normalisation. The colour of each marker represents stellar masses as indicated in the colour bar. The dashed red line denotes a piecewise linear fit to the data, with the fainter red region denoting its confidence interval. Each normalisation radius for the fit has been labelled accordingly.
Current usage metrics show cumulative count of Article Views (full-text article views including HTML views, PDF and ePub downloads, according to the available data) and Abstracts Views on Vision4Press platform.
Data correspond to usage on the plateform after 2015. The current usage metrics is available 48-96 hours after online publication and is updated daily on week days.
Initial download of the metrics may take a while.