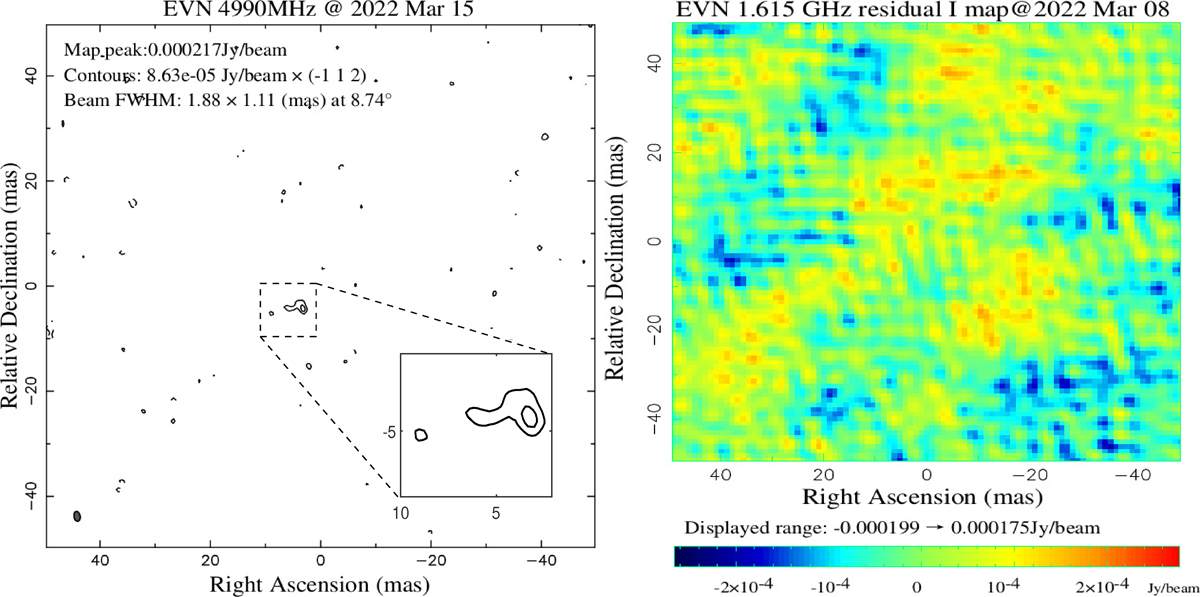
Fig. 3.
Download original image
EVN L- and C-band radio continuum images of the SE nucleus of IRAS 17526+3253 using natural weighting. The plots are centered at RA = 17:54:30.554, Dec = 32:53:06.09. The map peak intensity, contour levels, and beam FWHM are labeled in the EVN C-band image (left panel). The first contour in all images corresponds to a SNR of approximately 3 (3σ). The color image in the right panel shows the L-band map, where no significant structure is detected above the 3σ noise level (approximately 0.18 mJy/beam).
Current usage metrics show cumulative count of Article Views (full-text article views including HTML views, PDF and ePub downloads, according to the available data) and Abstracts Views on Vision4Press platform.
Data correspond to usage on the plateform after 2015. The current usage metrics is available 48-96 hours after online publication and is updated daily on week days.
Initial download of the metrics may take a while.