Open Access
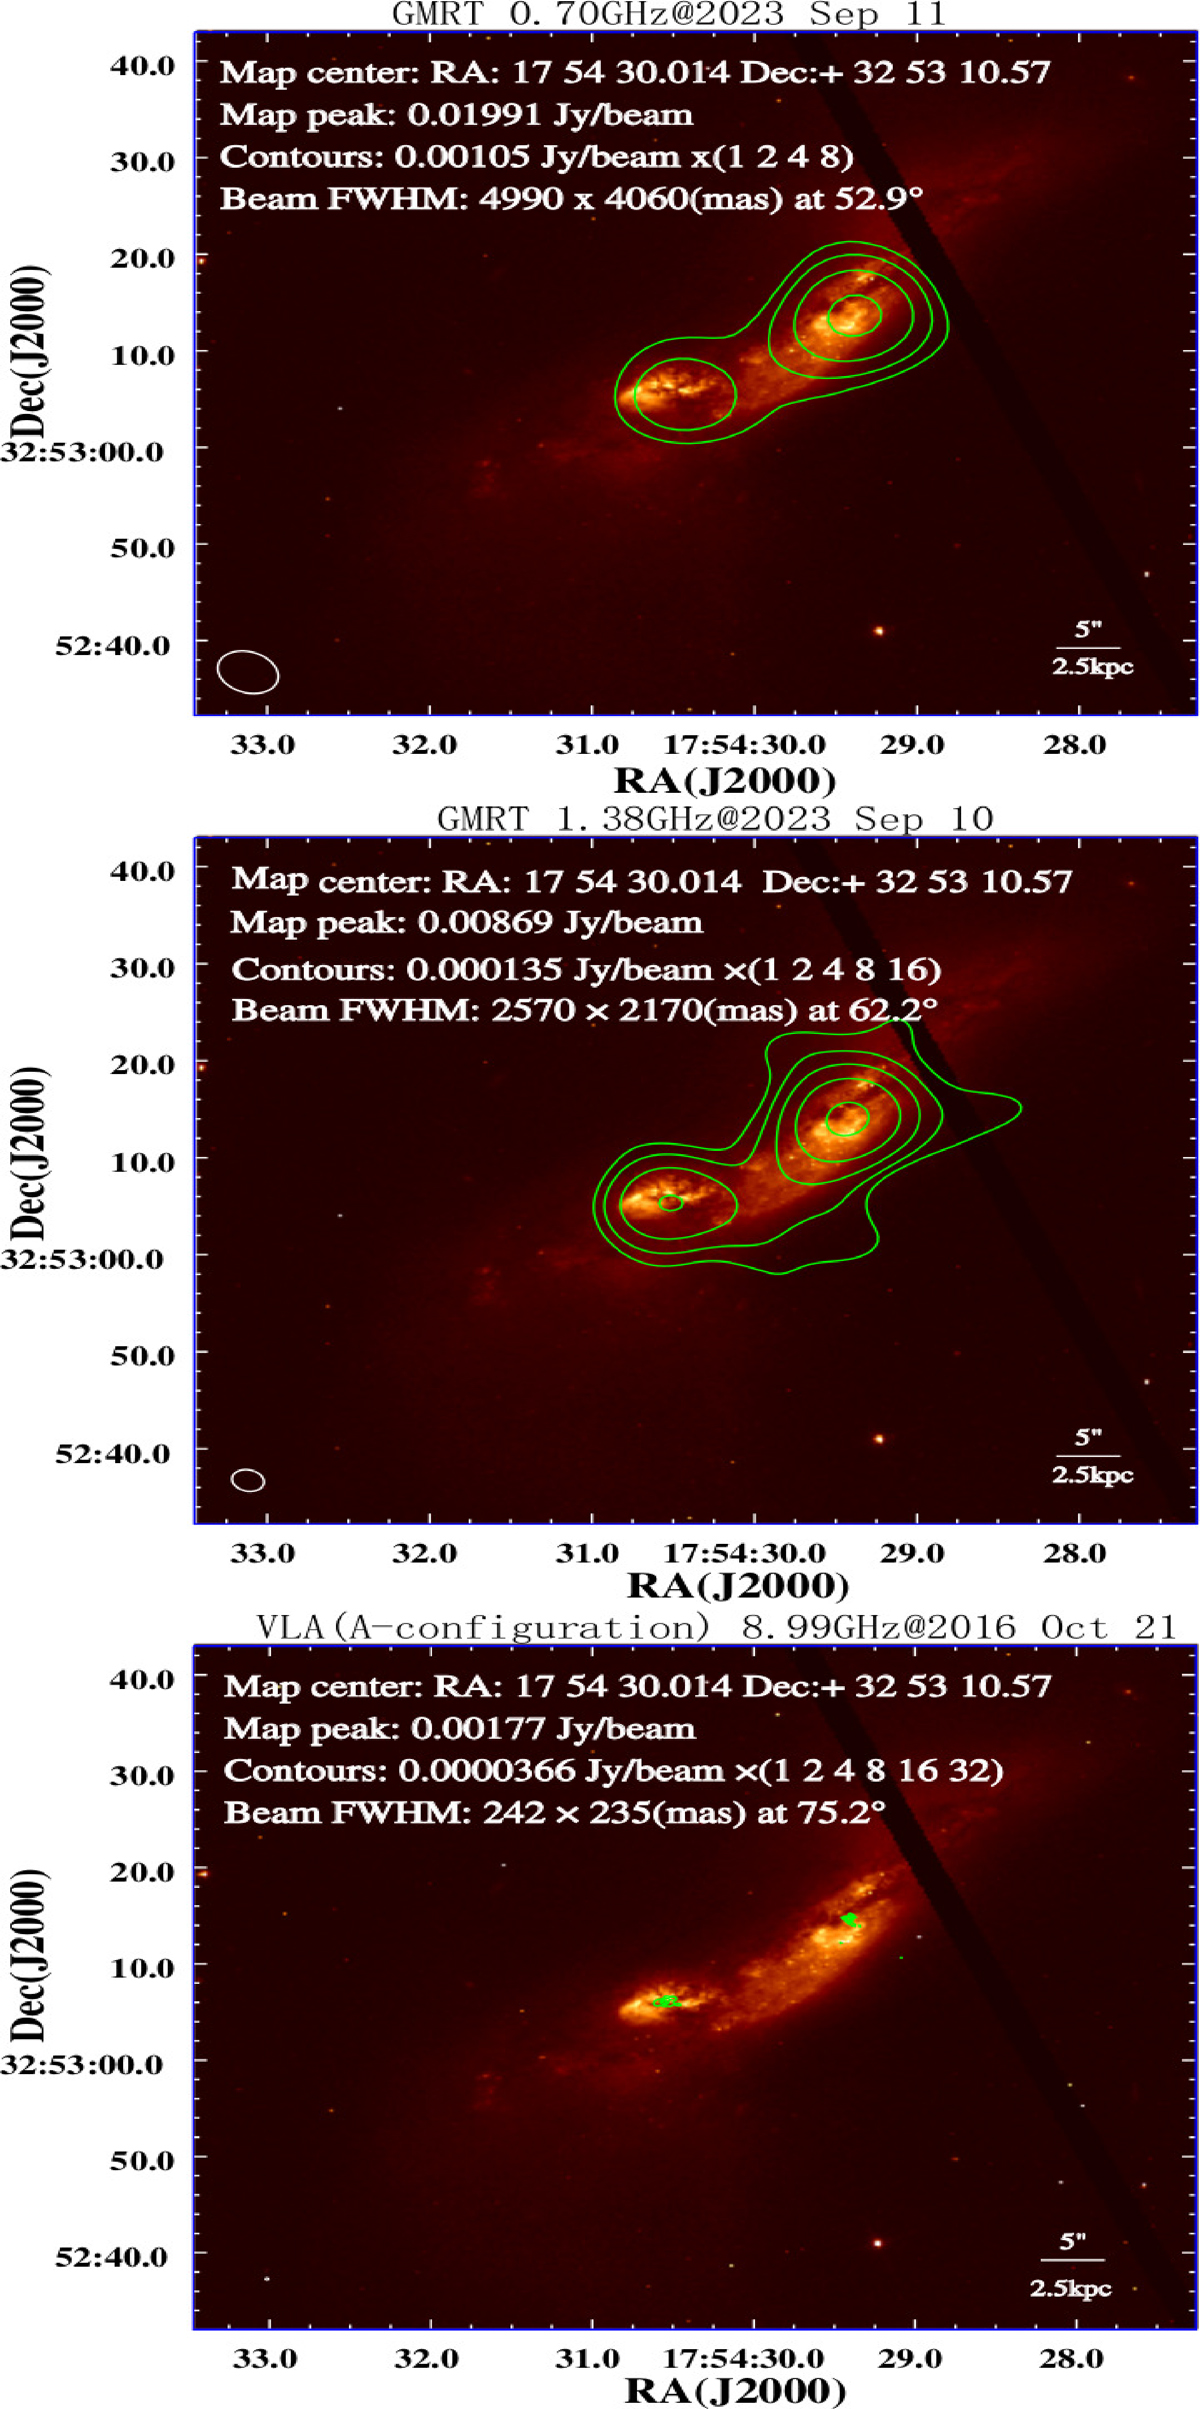
Fig. 4.
Download original image
Multiband radio contour maps of IRAS 17526+3253 from GMRT and VLA data overlaid on the HST/ACS F814W(I) image. The map peak intensity, contour levels, and beam FWHM are indicated in each image. The first contour in all images corresponds to a level of approximately 3σ.
Current usage metrics show cumulative count of Article Views (full-text article views including HTML views, PDF and ePub downloads, according to the available data) and Abstracts Views on Vision4Press platform.
Data correspond to usage on the plateform after 2015. The current usage metrics is available 48-96 hours after online publication and is updated daily on week days.
Initial download of the metrics may take a while.