Fig. 5.
Download original image
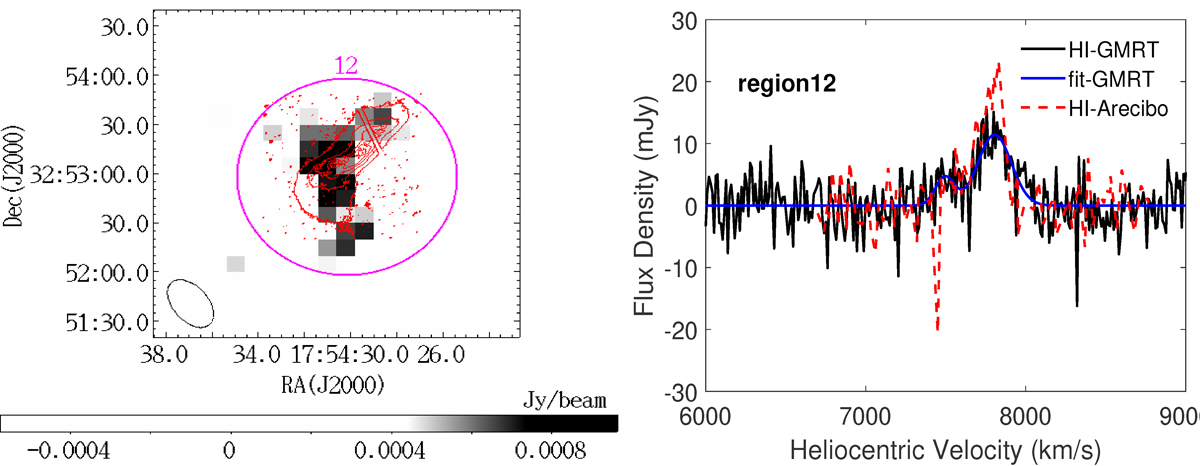
Low-resolution H I line emission image of IRAS 17526+3253. Left panel: grayscale image displays the combined continuum-subtracted H I emission (moment = −1 map) with velocities ranging from 7385 to 7910 km s−1. The beam FWHM is 33.25 arcsec × 19.76 arcsec at a position angle of 35 degrees. The grayscale range is shown at the bottom of the image. The red contour is derived from the colored HST image presented in Fig. 1. Right panel: The black solid line represents the detected H I spectrum within a 2-arcmin region (region 12) shown in the left panel. The blue line corresponds to the fit Gaussian line profile, with the parameters listed in Table A.1, while the dashed red line represents the H I line profile observed with the Arecibo telescope, as reported by Garwood et al. (1987).
Current usage metrics show cumulative count of Article Views (full-text article views including HTML views, PDF and ePub downloads, according to the available data) and Abstracts Views on Vision4Press platform.
Data correspond to usage on the plateform after 2015. The current usage metrics is available 48-96 hours after online publication and is updated daily on week days.
Initial download of the metrics may take a while.