Fig. 6.
Download original image
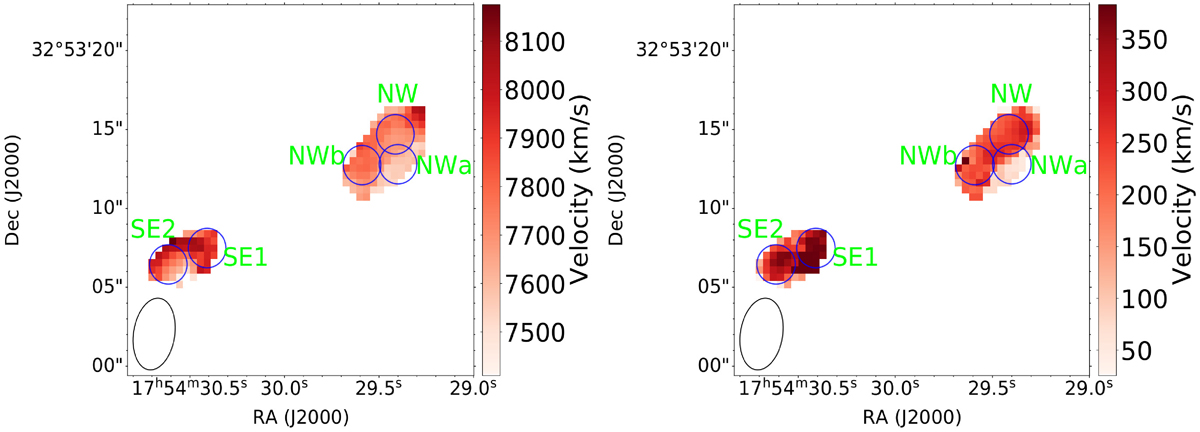
Velocity centroid (left) and dispersion (right) maps generated using the SoFiA software for the high-resolution H I image. The blue circles indicate the five regions from which the H I absorption lines were extracted, each with a size of 2.5″ × 2.5″. NW corresponds to the NW1 component in the EVN images shown in Fig. 2, where “NWa” and “NWb” are defined following Sales et al. (2019). “SE1” and “SE2” were selected based on the H I absorption image. The line profiles of these regions are shown in Fig. A.1, and the corresponding parameters are presented in Table A.1.
Current usage metrics show cumulative count of Article Views (full-text article views including HTML views, PDF and ePub downloads, according to the available data) and Abstracts Views on Vision4Press platform.
Data correspond to usage on the plateform after 2015. The current usage metrics is available 48-96 hours after online publication and is updated daily on week days.
Initial download of the metrics may take a while.