Fig. 7.
Download original image
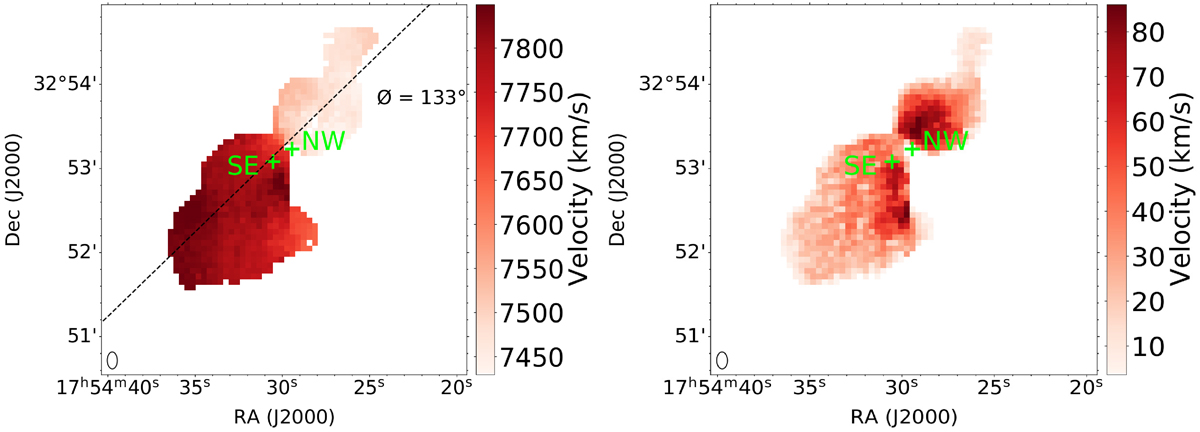
Velocity centroid (left) and dispersion (right) maps generated using the SoFiA software for the medium-resolution H I image. The green crosses labeled “NW” and “SE” mark the positions of the NW and SE nuclei as seen in the EVN radio continuum images (Figs. 2 and 3). Here, “NW” corresponds to the NW1 component in those EVN images. The dashed black line indicates the major axis identified by the SoFiA software for extracting the PV diagram. The corresponding dynamical center is shown in Fig. A.1.
Current usage metrics show cumulative count of Article Views (full-text article views including HTML views, PDF and ePub downloads, according to the available data) and Abstracts Views on Vision4Press platform.
Data correspond to usage on the plateform after 2015. The current usage metrics is available 48-96 hours after online publication and is updated daily on week days.
Initial download of the metrics may take a while.