Open Access
Fig. A.1.
Download original image
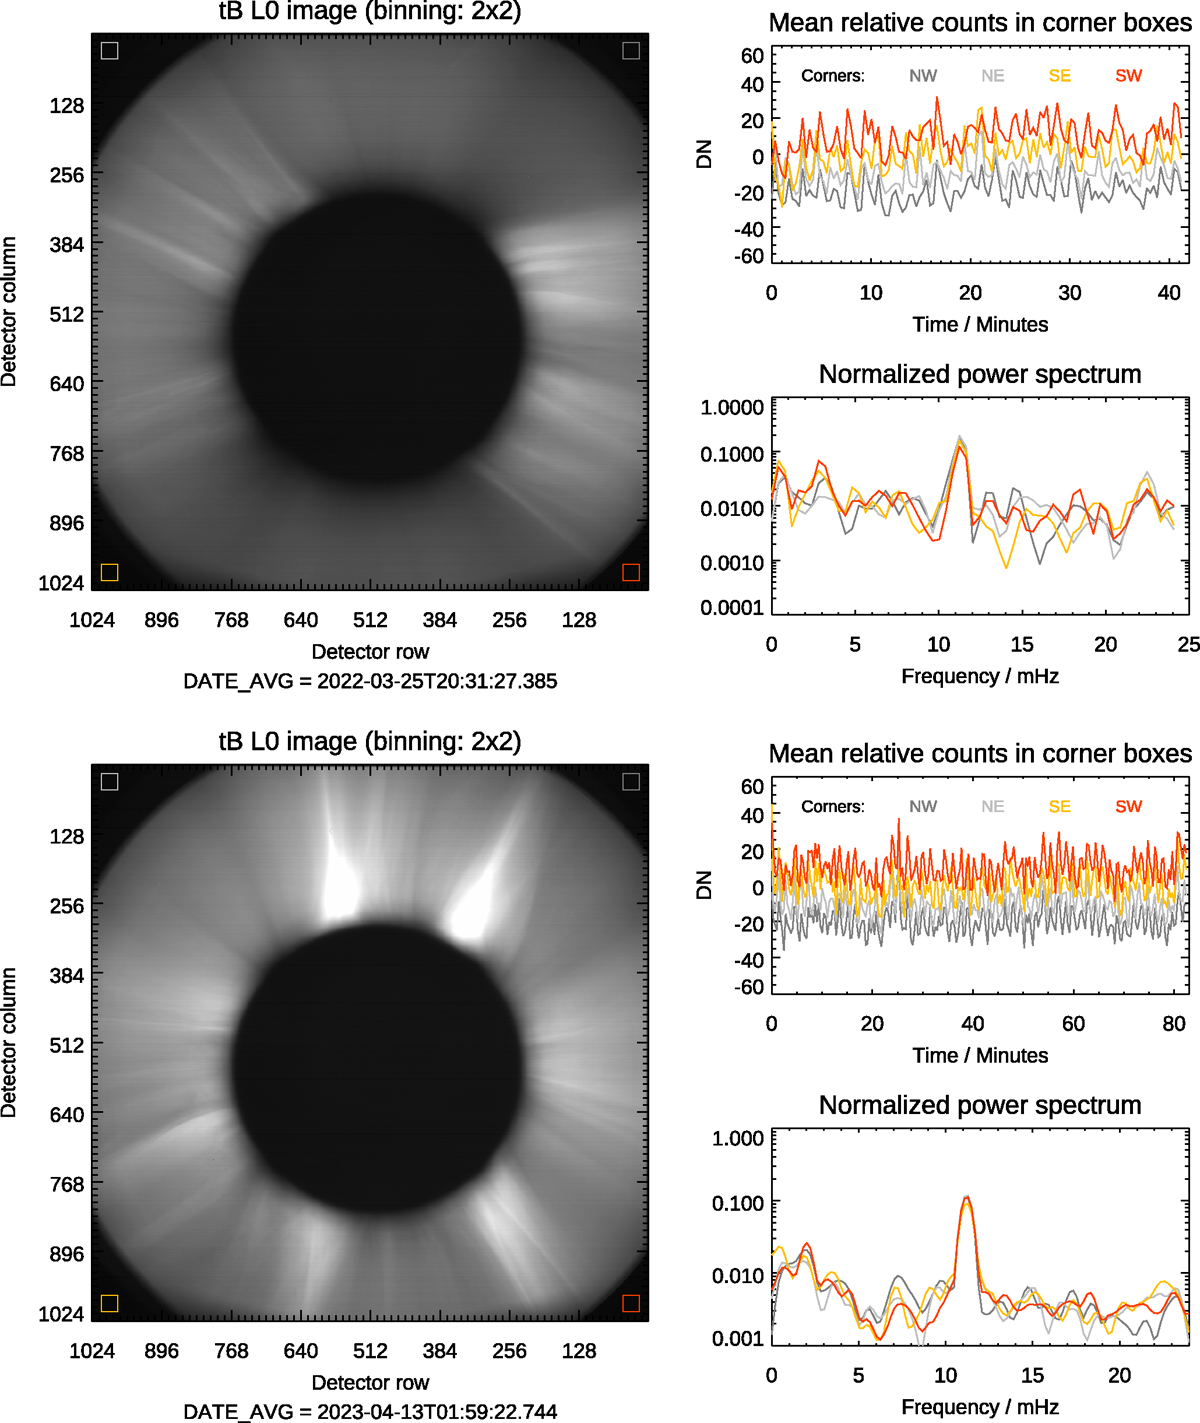
Left panel: position of sample boxes in detector regions not illuminated by the telescope. Top-right panel: Temporal variation of the median counts in those sample boxes (an offset of 15 DNs has been added to each time sequence for display clarity); bottom-panel panel: The corresponding normalised power spectra.
Current usage metrics show cumulative count of Article Views (full-text article views including HTML views, PDF and ePub downloads, according to the available data) and Abstracts Views on Vision4Press platform.
Data correspond to usage on the plateform after 2015. The current usage metrics is available 48-96 hours after online publication and is updated daily on week days.
Initial download of the metrics may take a while.