Fig. B.1.
Download original image
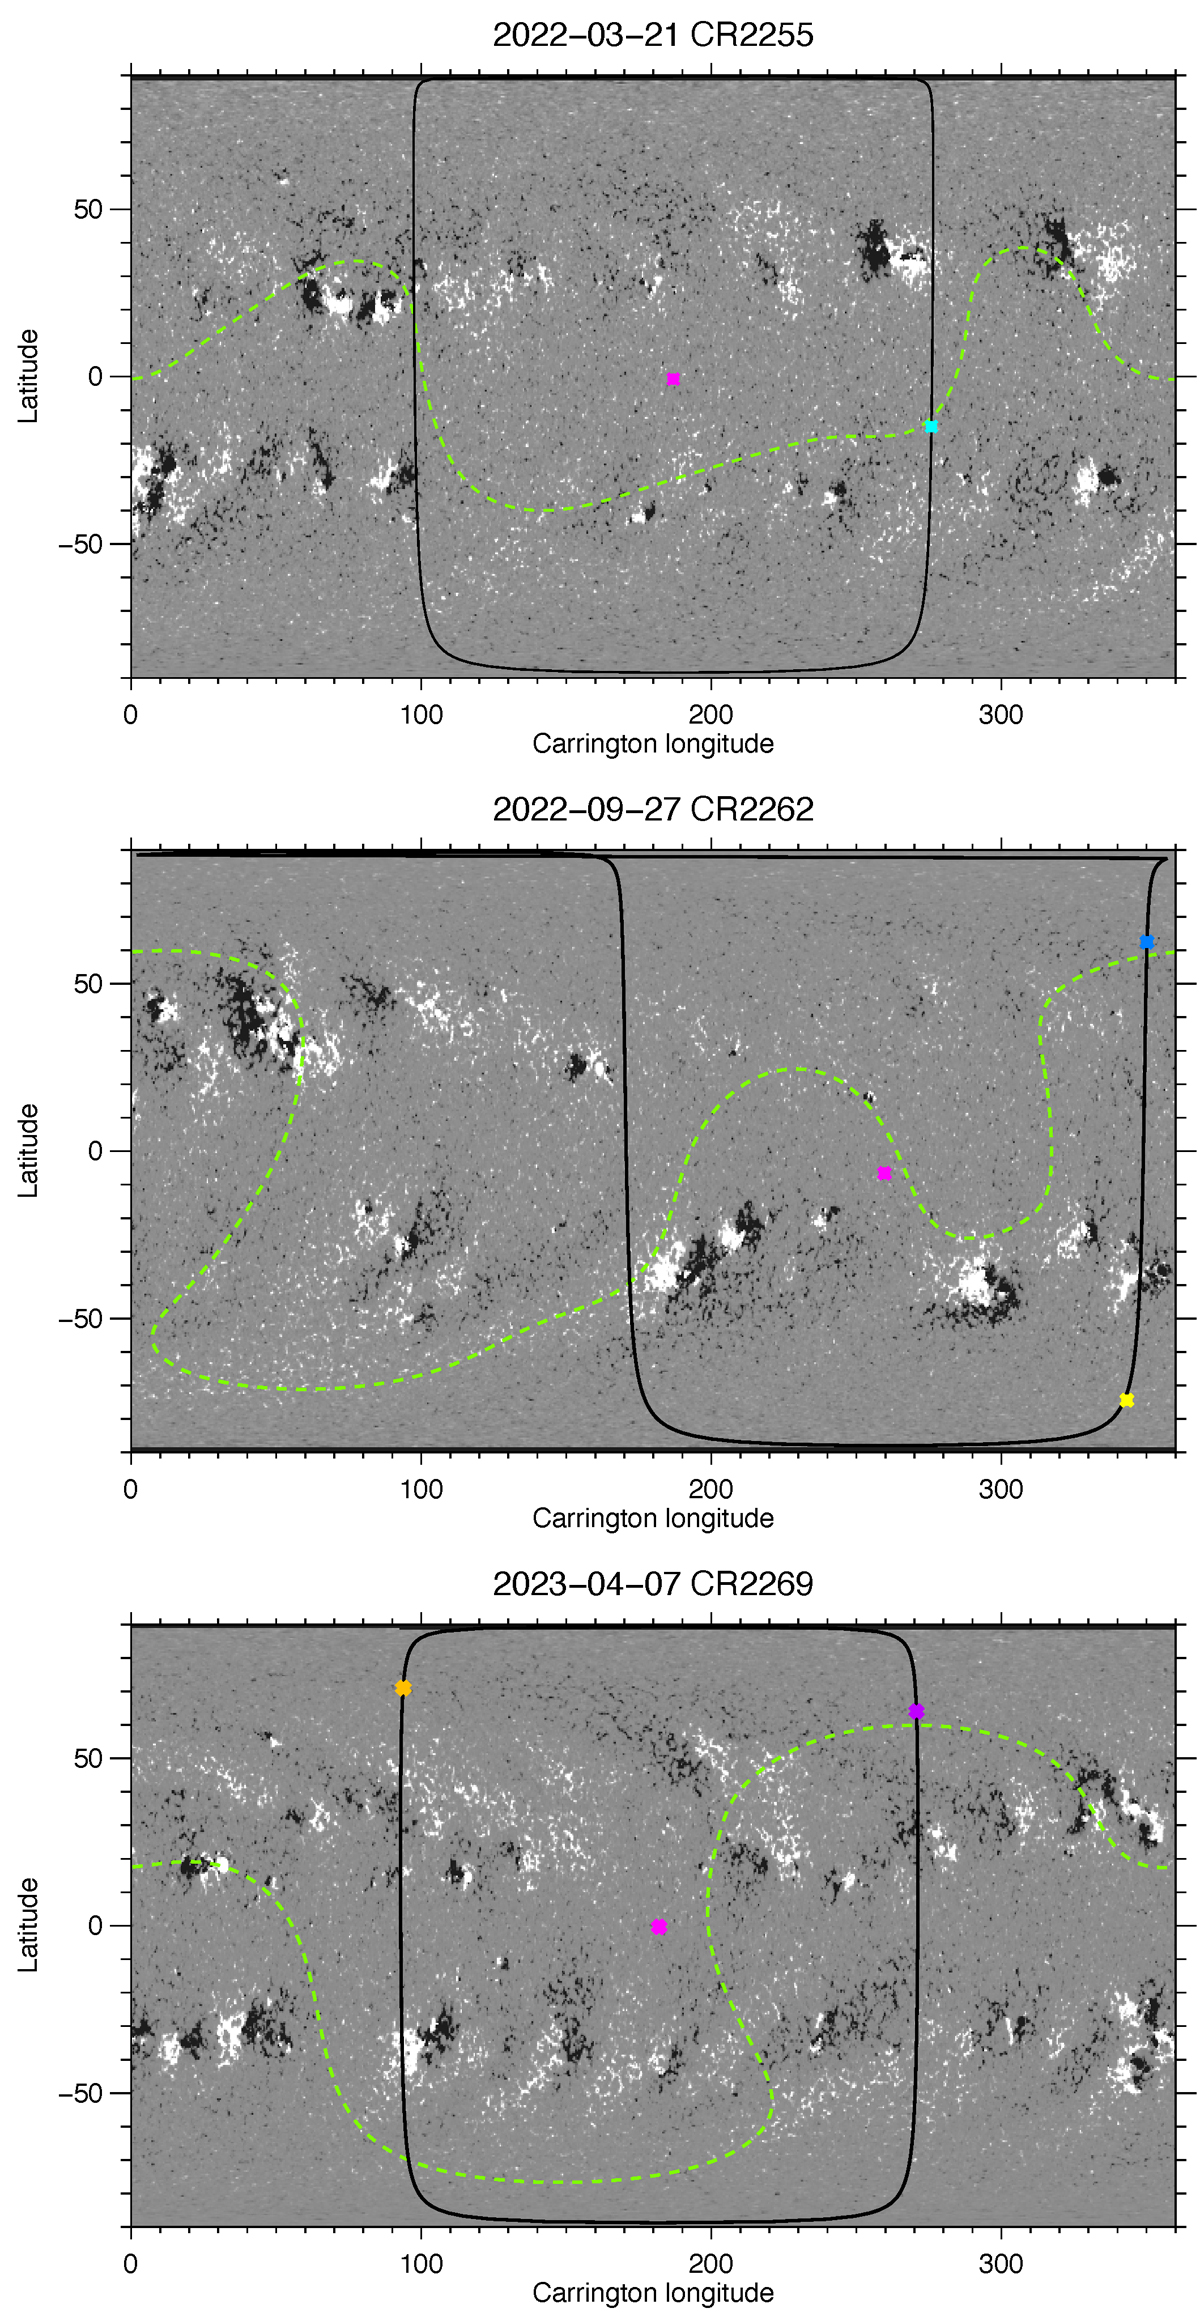
Synoptic charts of the photospheric line-of-sight magnetic field for the Carrington Rotations corresponding to the observation discussed in this work, obtained from HMI full-disc magnetograms. The limb of the visible disc as seen by Solar Orbiter is shown as a black line. The dashed green lines outline the HCS produced by the magnetic reconstruction as provided by the Magnetic Connectivity Tool. Pink dots indicate the Sun centre as seen by Solar Orbiter. Coloured star points are the projection on the solar disc of the central position of each region of interest defined on the Metis plane of the sky, with the following colour codes: cyan for A, light blue for B, yellow for C, purple for D and orange for E.
Current usage metrics show cumulative count of Article Views (full-text article views including HTML views, PDF and ePub downloads, according to the available data) and Abstracts Views on Vision4Press platform.
Data correspond to usage on the plateform after 2015. The current usage metrics is available 48-96 hours after online publication and is updated daily on week days.
Initial download of the metrics may take a while.