Fig. 2.
Download original image
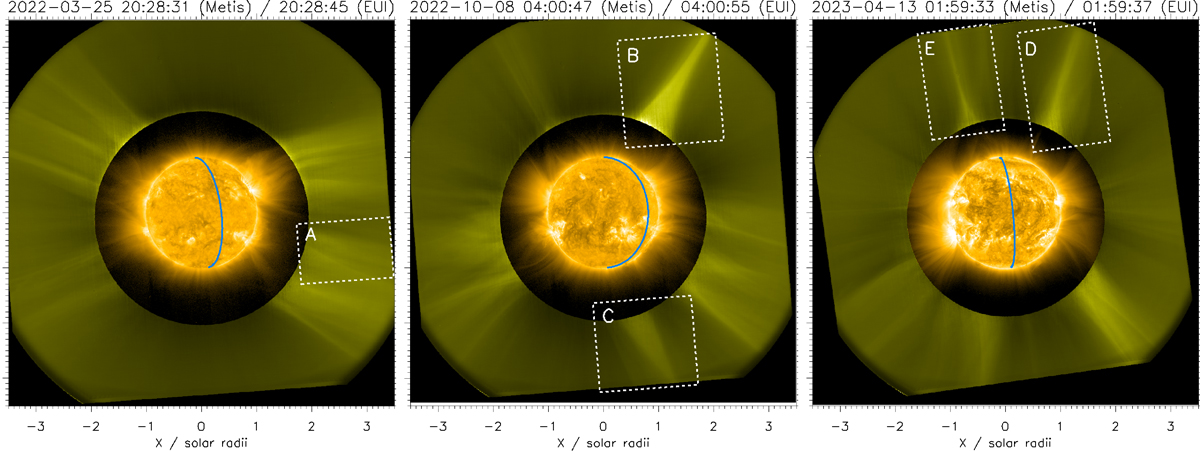
Metis and EUI composite images of the corona during the first three perihelia of the Solar Orbiter mission, from left to right. Labelled boxes mark the ROIs discussed in this work. The EUI image shown for context within the occulted Metis area was obtained in the FSI174 band. The blue line shows the position of the solar limb seen from Earth. Metis images have been normalised by the average coronal intensity profile of that date (obtained as described in Sect. 3.2), while EUI/FSI174 images are displayed on a logarithmic scale.
Current usage metrics show cumulative count of Article Views (full-text article views including HTML views, PDF and ePub downloads, according to the available data) and Abstracts Views on Vision4Press platform.
Data correspond to usage on the plateform after 2015. The current usage metrics is available 48-96 hours after online publication and is updated daily on week days.
Initial download of the metrics may take a while.