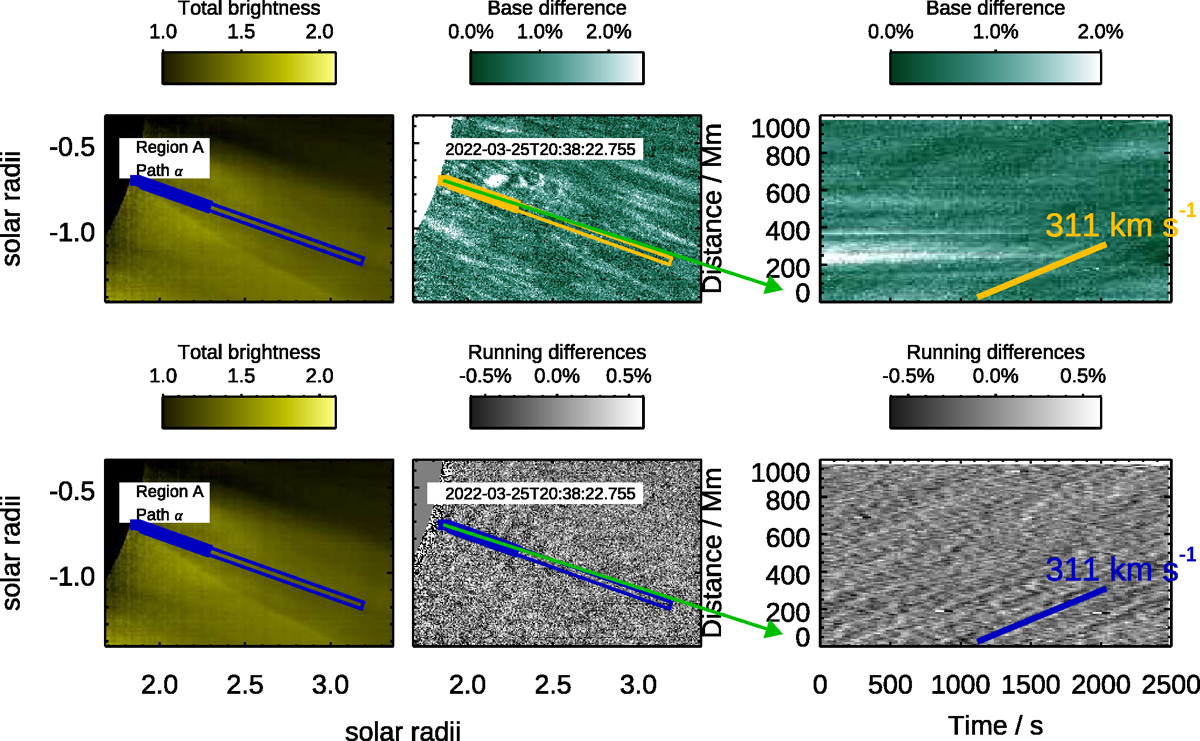
Fig. 4.
Download original image
Time-distance diagrams obtained from b(k) (top panels) and δb1(k) (bottom panels) along a selected path, labelled as α, in region A. The left and middle panels display a sample image from the series (I is shown in the left-hand panels). In both panels, the strip around the paths utilised to compute the time-distance diagrams is marked as a rectangle. The filled portion of the rectangle corresponds to the spatial extent of the feature marked in the time-distance diagram of the right panels. Right panel: Time-distance diagram along the selected path. The arrow shows the correspondence between the origin of the time-distance diagram and the first point of the path. A solid line, labelled with the corresponding apparent speed, is drawn over one of the periodic ridges visible in the time-distance diagrams.
Current usage metrics show cumulative count of Article Views (full-text article views including HTML views, PDF and ePub downloads, according to the available data) and Abstracts Views on Vision4Press platform.
Data correspond to usage on the plateform after 2015. The current usage metrics is available 48-96 hours after online publication and is updated daily on week days.
Initial download of the metrics may take a while.