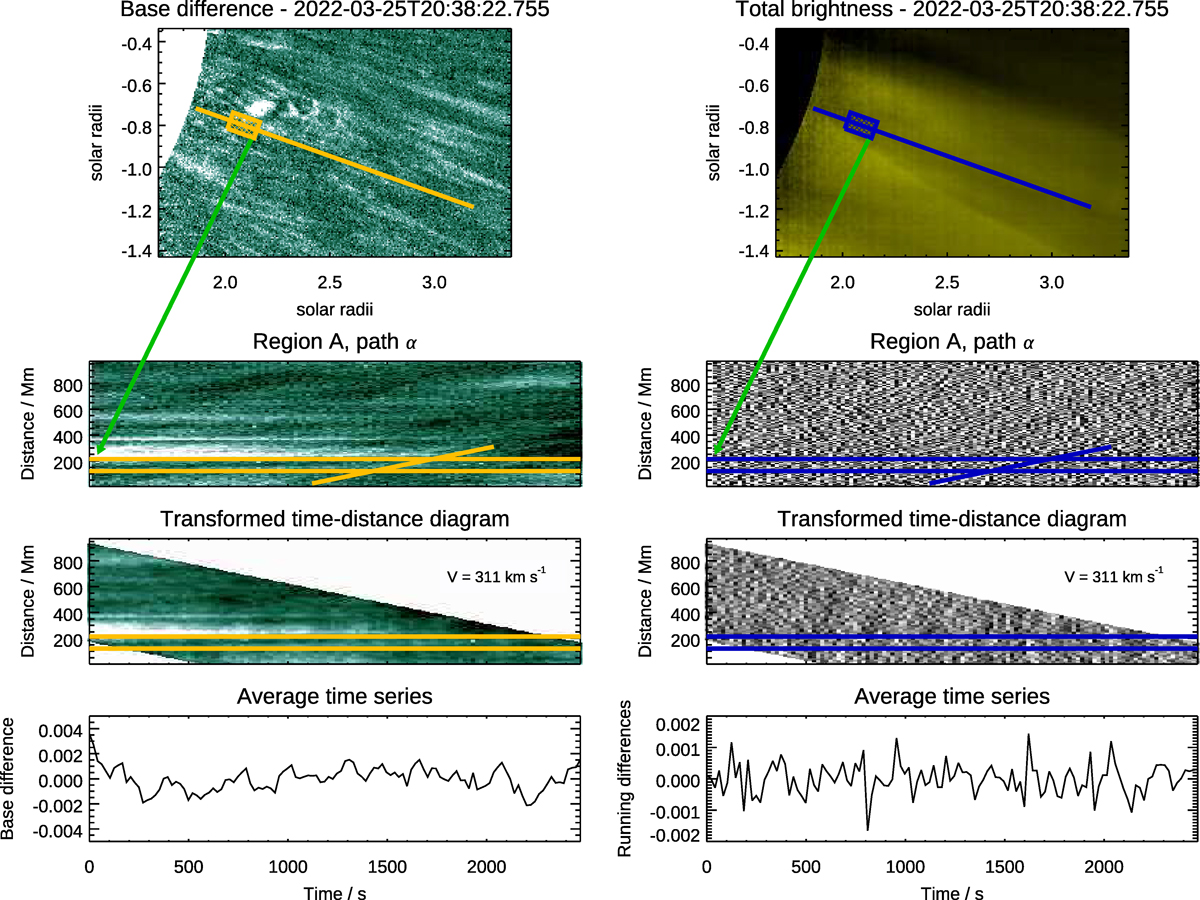
Fig. 7.
Download original image
Illustration of the procedure, described in Sect. 3.4, adopted to extract mean time series from a time-distance diagram along a path. The procedure refers in particular to a segment chosen along path A-α (see also Fig. 4). The left column refers to the procedure applied to base difference images b (top left panel), while the right column refers to running difference images δb0 (the image on the top right panel, however, is a total brightness image, I, to show the main coronal features in the ROI). The segment where the average time series is obtained is enclosed in a box along the selected path in the top panels. The transformed time-distance diagrams are shown in the second row; the range of distances that correspond to the box shown in the top panels are marked with horizontal lines, while one of the periodic ridges in the diagram is annotated as in Fig. 4 together with the speed (listed in Table 3) adopted for the transform procedure. The third row shows the transformed time-distance diagrams and the last row shows the time series averaged over the chosen segment.
Current usage metrics show cumulative count of Article Views (full-text article views including HTML views, PDF and ePub downloads, according to the available data) and Abstracts Views on Vision4Press platform.
Data correspond to usage on the plateform after 2015. The current usage metrics is available 48-96 hours after online publication and is updated daily on week days.
Initial download of the metrics may take a while.