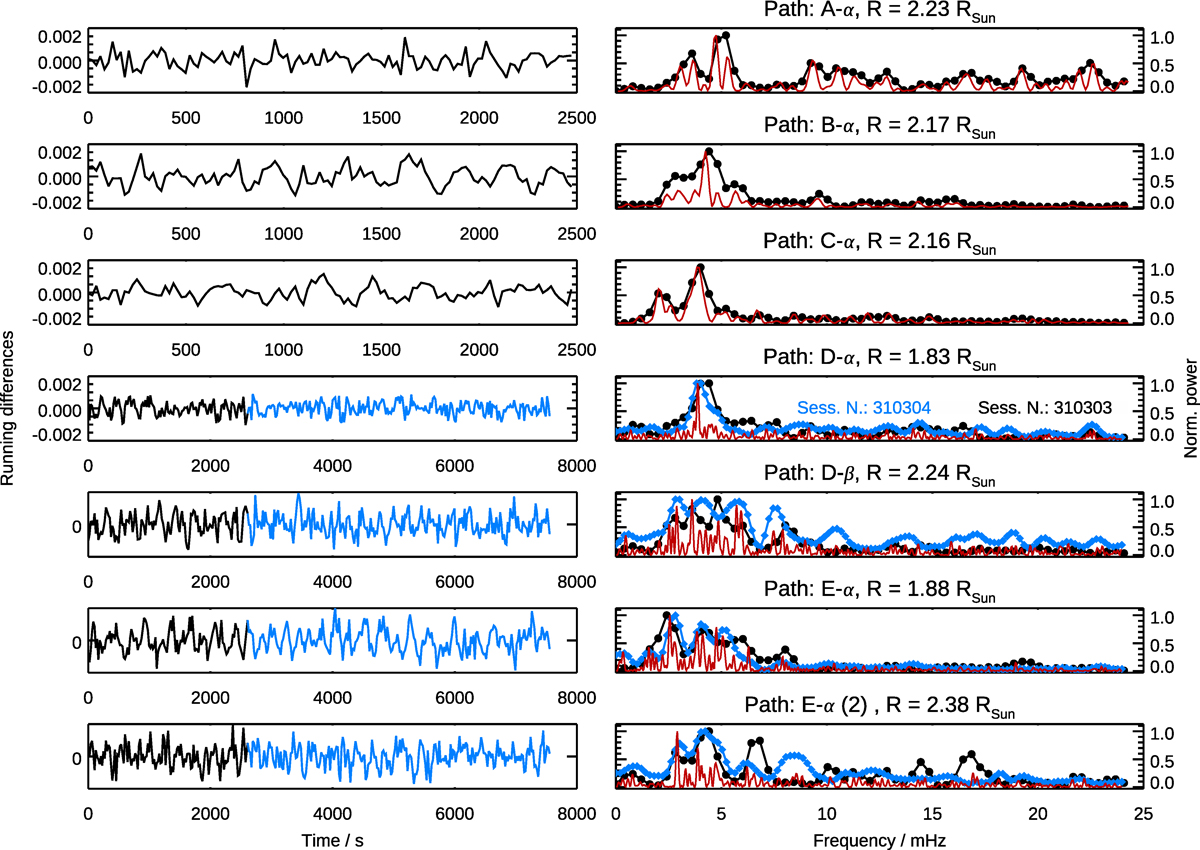
Fig. 9.
Download original image
Left panels: Summary of time series (left panels) derived with the procedure described in Sect. 3.4 in the middle of selected features among those identified in Figs 4, 5, and 6 and listed in Table 3. In the case of the 13 April 2023 observations, the time series obtained from dataset #4 (session no. 310304) are in shown in blue. Right panels: Corresponding power spectra for each dataset shown with the same colour coding. The Lomb normalised periodograms for the full time series are drawn with red lines. The power spectra and periodograms are normalised to their respective maximum values.
Current usage metrics show cumulative count of Article Views (full-text article views including HTML views, PDF and ePub downloads, according to the available data) and Abstracts Views on Vision4Press platform.
Data correspond to usage on the plateform after 2015. The current usage metrics is available 48-96 hours after online publication and is updated daily on week days.
Initial download of the metrics may take a while.