Fig. A.2.
Download original image
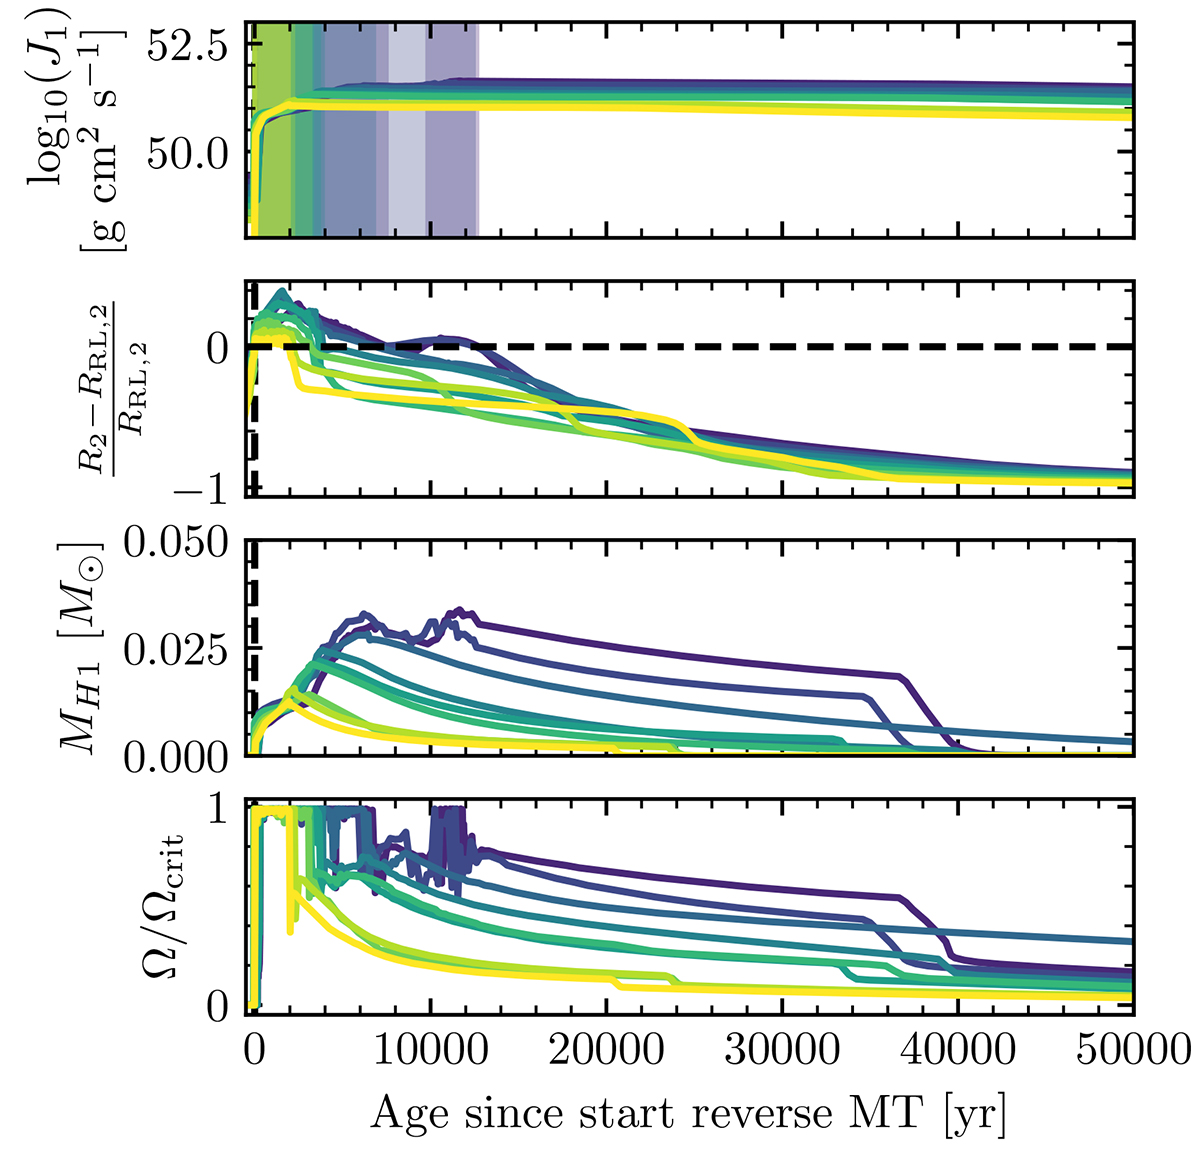
Stable-reverse-mass-transfer phase for the same models as in Figure A.1 with the same colour map, except for P = 26.83 days, which is not included. The models are aligned when starting the stable reverse-mass-transfer phase. The rows from top to bottom show the total angular momentum in the primary, the relative Roche lobe overflow factor of the secondary, the total hydrogen in the primary, and the fraction of critical rotation at the surface. In the top figure, the shaded areas indicate the reverse mass transfer.
Current usage metrics show cumulative count of Article Views (full-text article views including HTML views, PDF and ePub downloads, according to the available data) and Abstracts Views on Vision4Press platform.
Data correspond to usage on the plateform after 2015. The current usage metrics is available 48-96 hours after online publication and is updated daily on week days.
Initial download of the metrics may take a while.