Open Access
Fig. C.1.
Download original image
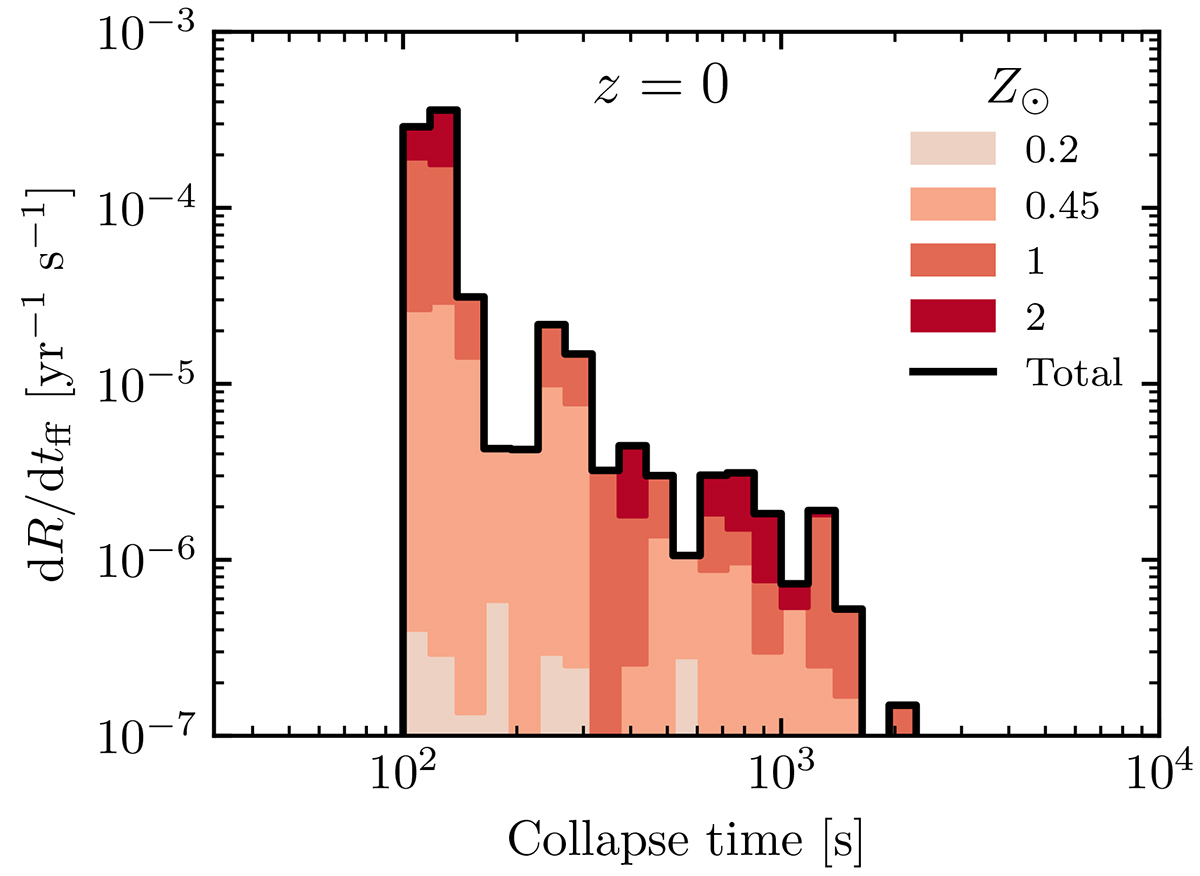
Free-fall collapse timescales of the stable reverse-mass-transfer progenitors at carbon depletion. Each model is weighted by its contribution at z = 0. The red shading areas are stacked histograms for each metallicity with the solid black line indicating the total differential rate.
Current usage metrics show cumulative count of Article Views (full-text article views including HTML views, PDF and ePub downloads, according to the available data) and Abstracts Views on Vision4Press platform.
Data correspond to usage on the plateform after 2015. The current usage metrics is available 48-96 hours after online publication and is updated daily on week days.
Initial download of the metrics may take a while.