Fig. 2
Download original image
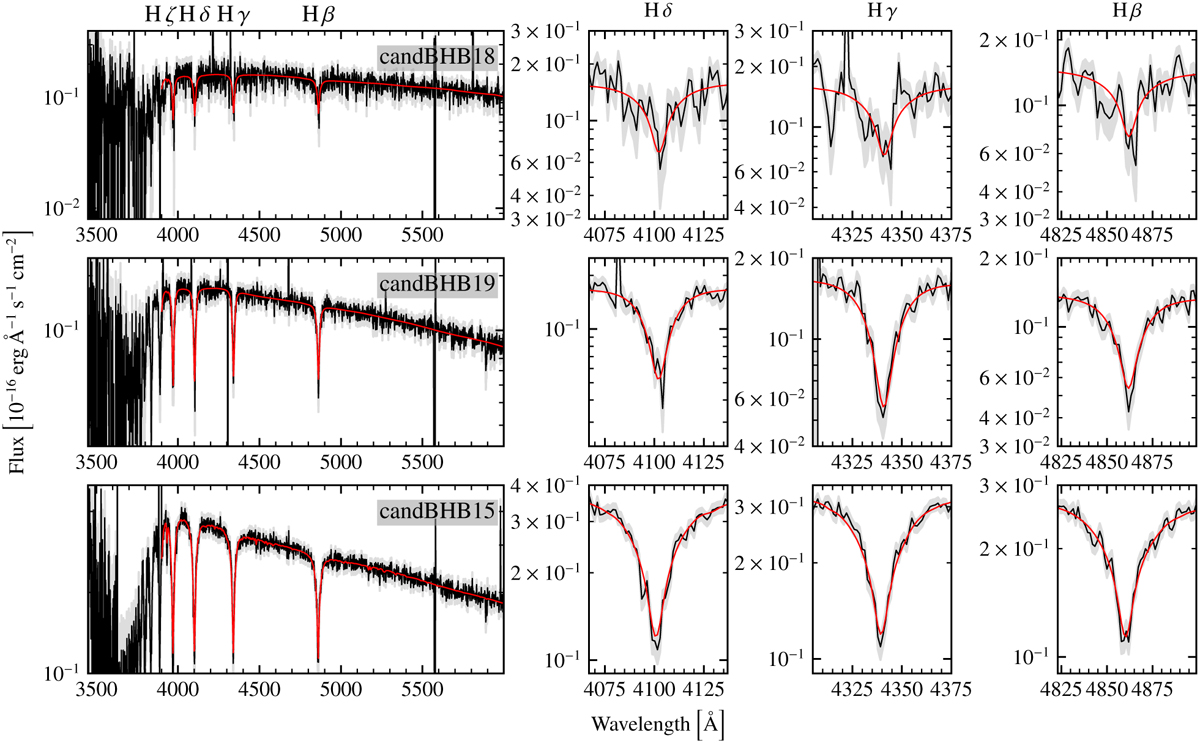
Example spectra of three candidate BHB stars listed in Table 1 are shown in the left panels where the wavelength scale is relative to the spectrograph’s reference frame at the time of each observation. The background shaded areas represent the uncertainties of the spectra. The solid red lines indicate the best-fitting models. The labels at the top annotate some of the strong Balmer lines visible in the spectra that can also be seen in the right panels for each example spectrum. We show the spectrum of the star with the lowest, median of, and highest median signal-to-noise ratio of all spectra across the dispersion axis considered for the fitting in the top, middle, and bottom panel, respectively.
Current usage metrics show cumulative count of Article Views (full-text article views including HTML views, PDF and ePub downloads, according to the available data) and Abstracts Views on Vision4Press platform.
Data correspond to usage on the plateform after 2015. The current usage metrics is available 48-96 hours after online publication and is updated daily on week days.
Initial download of the metrics may take a while.