Fig. 1.
Download original image
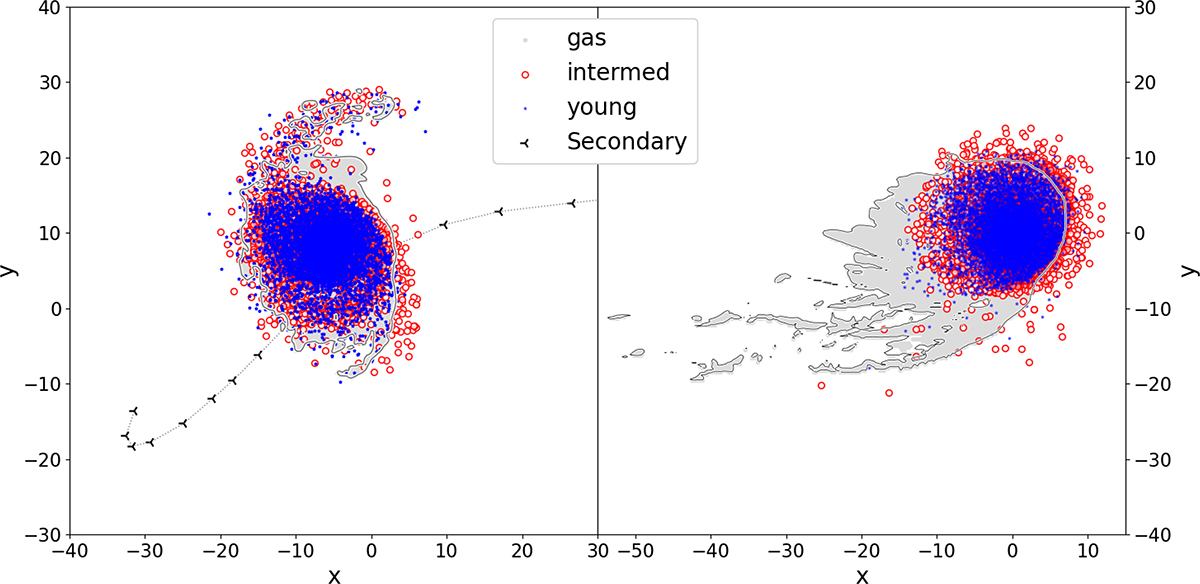
x–y distribution of the young stars (blue points, age < 200 Myr) and the intermediate-age stars (red circles, age 200–400 Myr) at simulation time tsim = 626 Myr of the TI-fid model (left) and the RP-fid model (right). The x–y distribution of the disk gas (density > 0.01 H/cc) is shown with gray shading and a darker gray outer contour line to highlight the extent of the disk gas. In the left panel, the trajectory of the secondary galaxy is marked with a symbol at intervals of 37 Myr. In the right panel, the ram pressure wind is blowing from right to left, along the x-axis.
Current usage metrics show cumulative count of Article Views (full-text article views including HTML views, PDF and ePub downloads, according to the available data) and Abstracts Views on Vision4Press platform.
Data correspond to usage on the plateform after 2015. The current usage metrics is available 48-96 hours after online publication and is updated daily on week days.
Initial download of the metrics may take a while.