Fig. D.1.
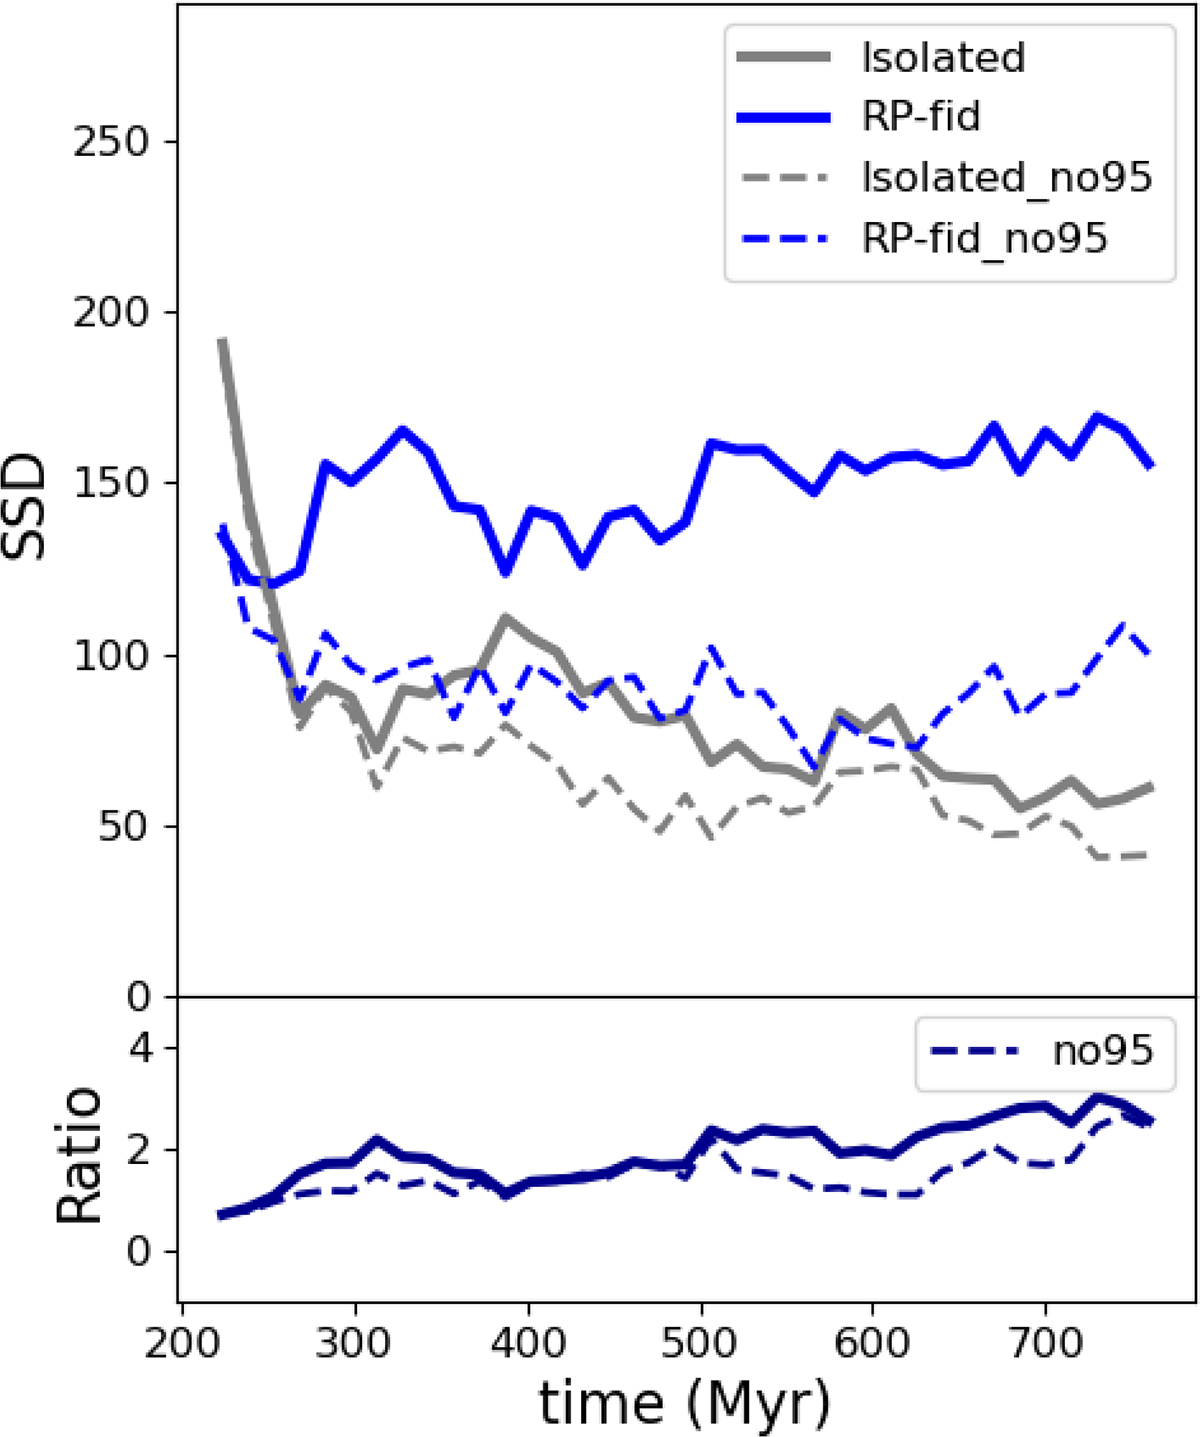
Download original image
Top panel: Evolution of the SSD value for the isolated (gray curves) and RP-fid (blue curves) model. Solid lines shows the SSD value using all the Lagrangian radii. Dashed lines shows the SSD values excluding the two outermost Lagrangian radii (additionally labeled ‘_no95’ in the legend). Bottom panel: Ratio of the SSD value of RP-fid model divided by the SSD value of the isolated model. The solid curve is with all Lagrangian radii, the dashed is excluding the two outermost Lagrangian radii (labeled ‘no95’ in the legend).
Current usage metrics show cumulative count of Article Views (full-text article views including HTML views, PDF and ePub downloads, according to the available data) and Abstracts Views on Vision4Press platform.
Data correspond to usage on the plateform after 2015. The current usage metrics is available 48-96 hours after online publication and is updated daily on week days.
Initial download of the metrics may take a while.