Fig. 7.
Download original image
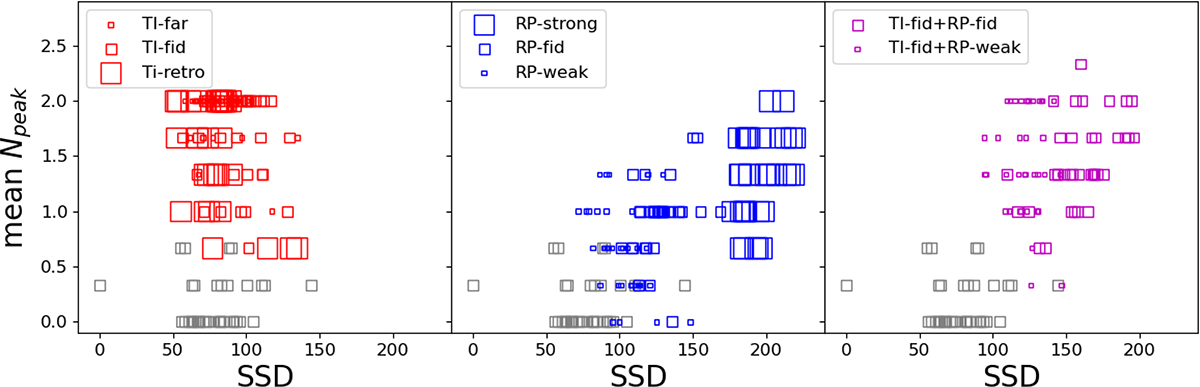
SSD on the x-axis versus mean number of peaks (Npeak) on the y-axis. A symbol is shown for each snapshot of the simulation with tsim > 220 Myr. Symbol size differentiates between the models (see legend in each panel). Left panel: the tidal interaction models TI-fid, TI-far, TI-retro show higher Npeak values compared with the isolated galaxy (gray points, shown in all panels for reference). Center panel: the ram pressure models RP-weak, RP-fid, RP-strong are shown. Right panel: Models where tidal interactions are combined with ram pressure are shown (TI-fid+RP-fid and TI-fid+RP-weak).
Current usage metrics show cumulative count of Article Views (full-text article views including HTML views, PDF and ePub downloads, according to the available data) and Abstracts Views on Vision4Press platform.
Data correspond to usage on the plateform after 2015. The current usage metrics is available 48-96 hours after online publication and is updated daily on week days.
Initial download of the metrics may take a while.