Fig. 12
Download original image
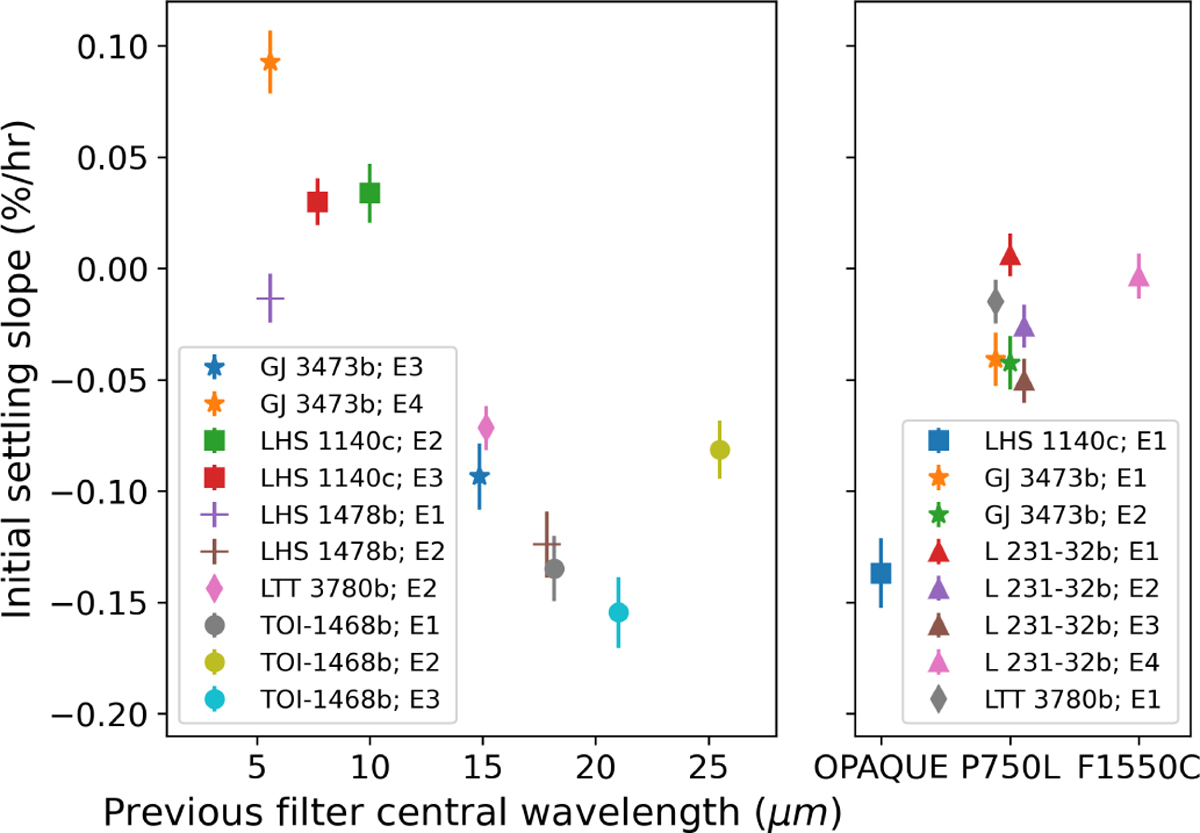
Possible trend in detector settling based on the previous filter used by MIRI. The mean and uncertainty in the slope of the first 30 minutes of the aperture extracted light curve is plotted for various Hot Rocks observations. Left plot shows previous imaging filters based on their central wavelength, the right plot includes the OPAQUE position for darks, the P750L prism for LRS and a coronagraphic filter. Observations which shared the same previous filters often display similar detector settling.
Current usage metrics show cumulative count of Article Views (full-text article views including HTML views, PDF and ePub downloads, according to the available data) and Abstracts Views on Vision4Press platform.
Data correspond to usage on the plateform after 2015. The current usage metrics is available 48-96 hours after online publication and is updated daily on week days.
Initial download of the metrics may take a while.