Fig. 13
Download original image
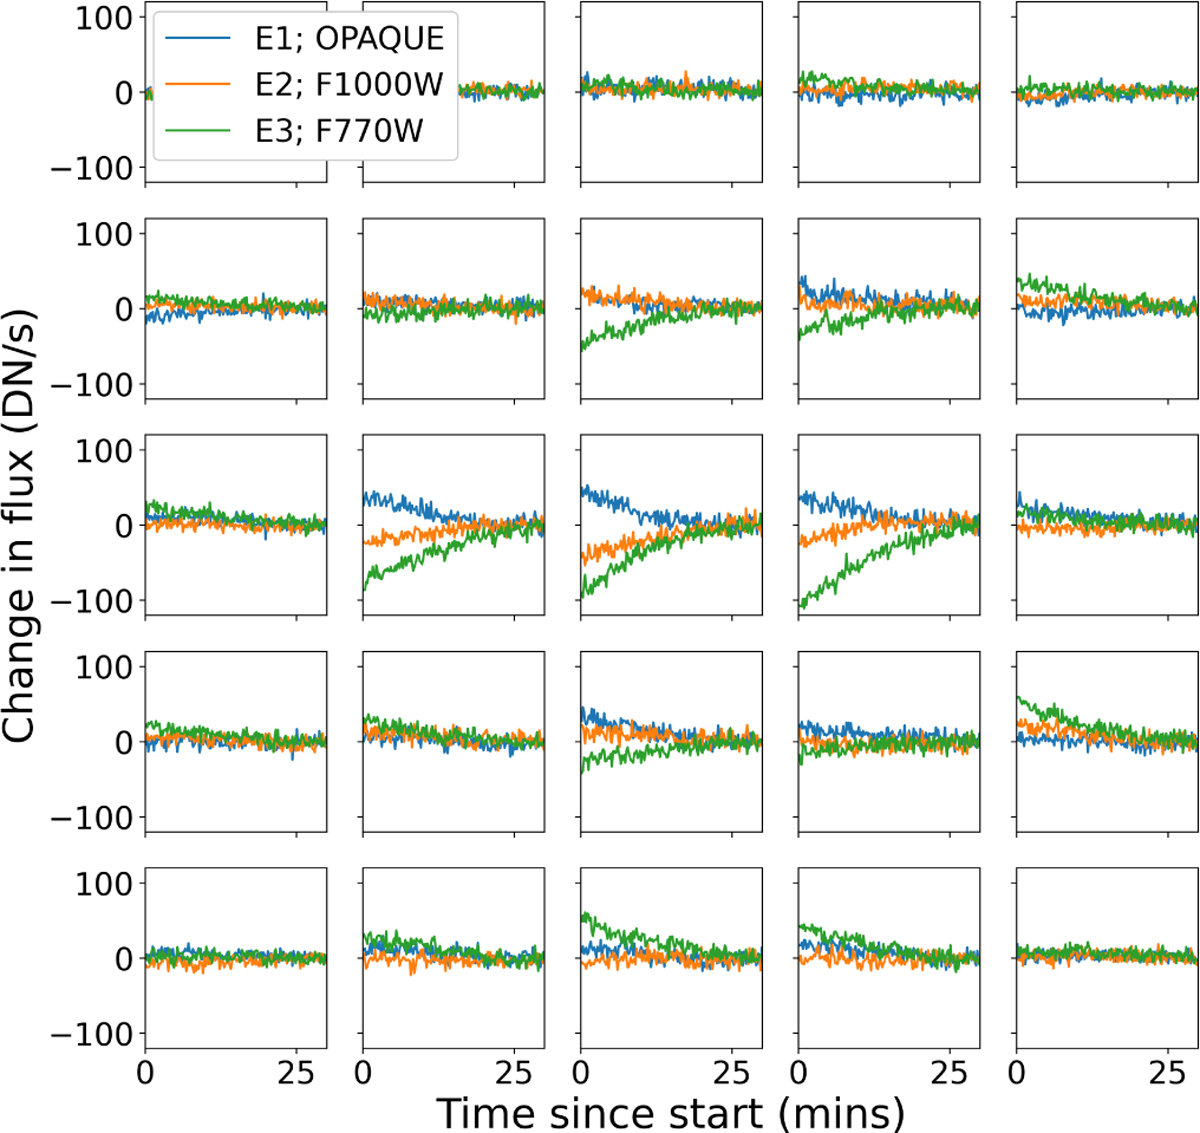
Central pixel light curves for the first 30 minutes of each LHS 1140c eclipse. Each plot shows the change in flux relative to the last ten integrations of the first 30 minutes. The legend specifies which previous filter was in place for each eclipse. Note the strong differences in the central pixel light curves, particularly between the first eclipse (which switched from the OPAQUE filter) and the third eclipse (which switched from the F770W filter).
Current usage metrics show cumulative count of Article Views (full-text article views including HTML views, PDF and ePub downloads, according to the available data) and Abstracts Views on Vision4Press platform.
Data correspond to usage on the plateform after 2015. The current usage metrics is available 48-96 hours after online publication and is updated daily on week days.
Initial download of the metrics may take a while.