Fig. 16
Download original image
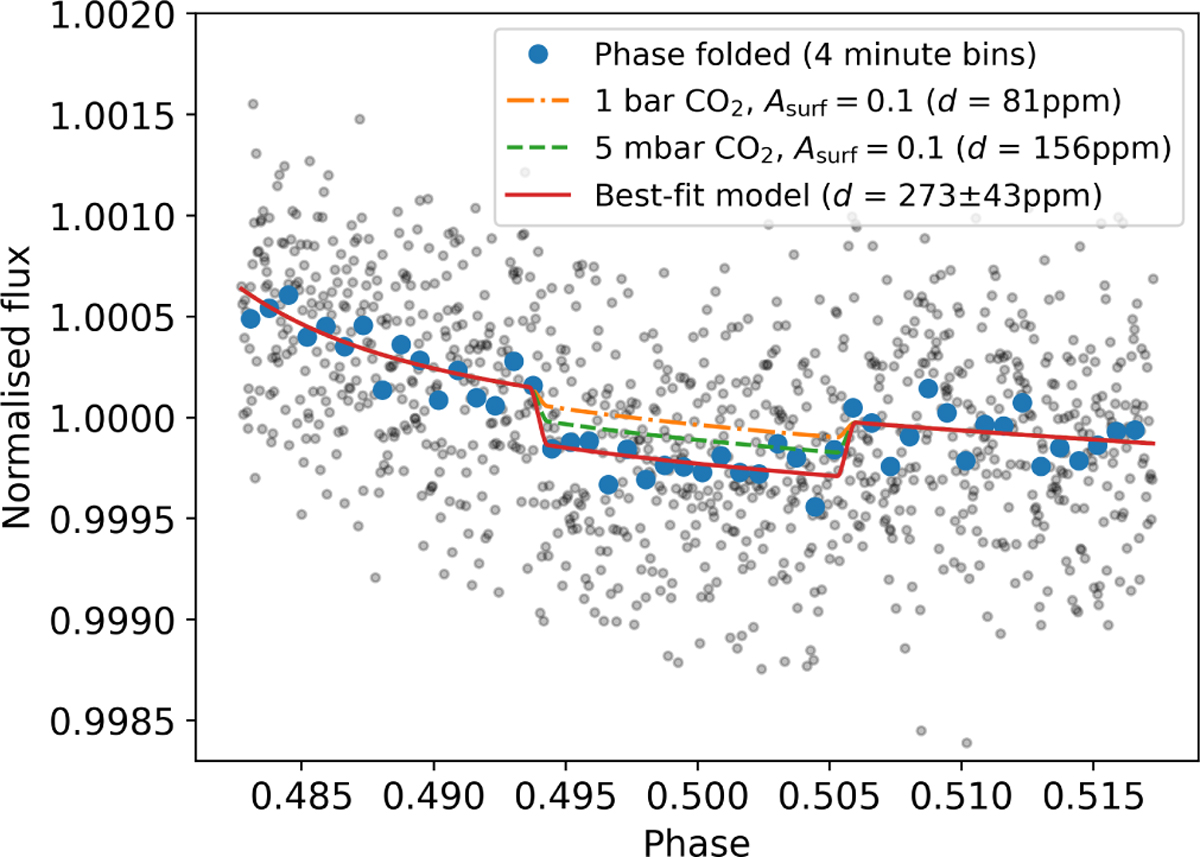
Phase-folded observations compared to model light curves of pure CO2 atmospheres. Observations plotted without binning (black) and with binning (blue circles). In red is the phase folded best-fit eclipse model from joint-fitting the aperture extracted light curves with a GP. The orange and green dashed lines show expected eclipse depths for different pressure pure CO2 atmospheres.
Current usage metrics show cumulative count of Article Views (full-text article views including HTML views, PDF and ePub downloads, according to the available data) and Abstracts Views on Vision4Press platform.
Data correspond to usage on the plateform after 2015. The current usage metrics is available 48-96 hours after online publication and is updated daily on week days.
Initial download of the metrics may take a while.