Fig. B.1
Download original image
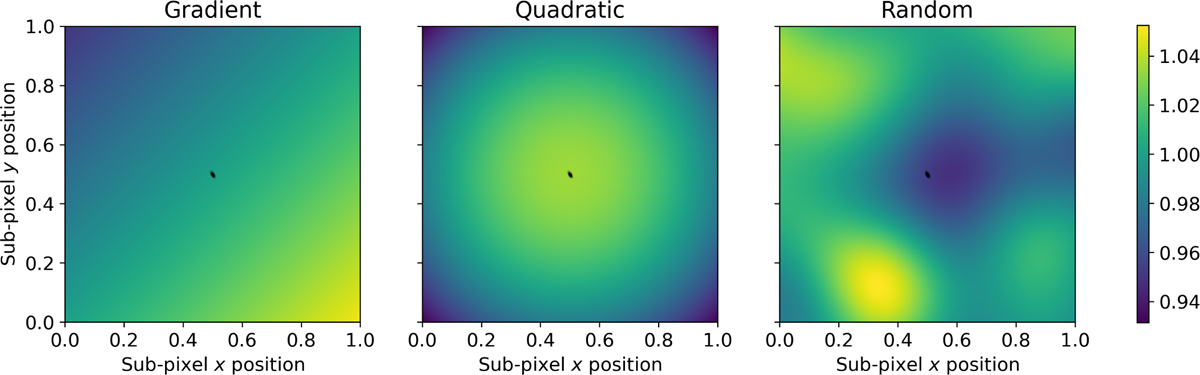
Various normalised sub-pixel sensitivity maps tested to examine intrapixel sensitivity. The colour scale gives the relative efficiency at each sub-pixel location. We visualise the level of pointing variation across an observation by plotting black dots for each centroid position in the first eclipse around the centre of each pixel map.
Current usage metrics show cumulative count of Article Views (full-text article views including HTML views, PDF and ePub downloads, according to the available data) and Abstracts Views on Vision4Press platform.
Data correspond to usage on the plateform after 2015. The current usage metrics is available 48-96 hours after online publication and is updated daily on week days.
Initial download of the metrics may take a while.