Fig. F.1
Download original image
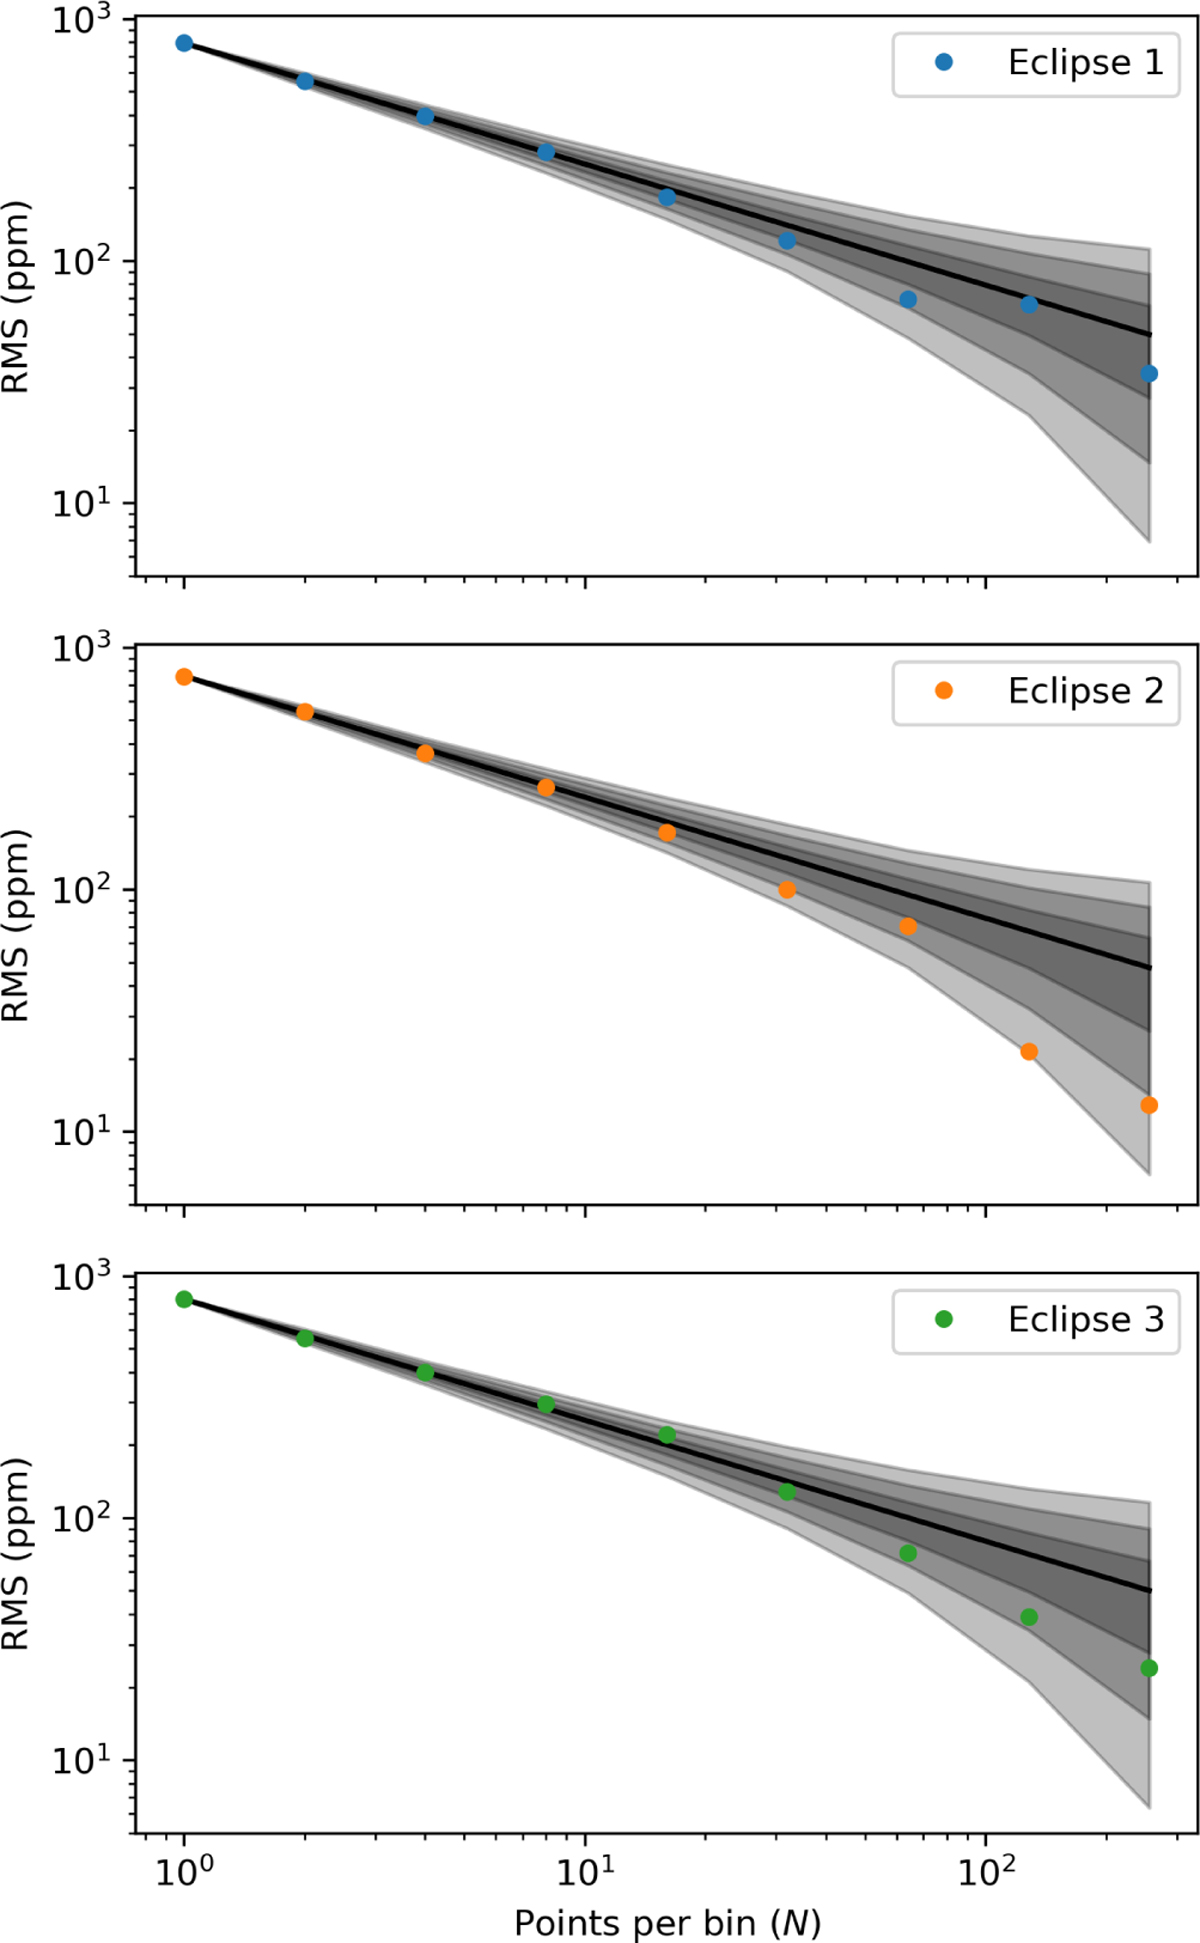
Allan deviation plot for each eclipse. The black line denotes the ![]() trend expected for uncorrelated noise, while the shaded regions denote the 1σ, 2σ and 3σ confidence intervals for each particular binning calculated using 10,000 white noise draws. We note that only 75% of the white noise draws stay within the 2σ intervals for all bin sizes tested. We see that there can be a particularly large range of deviation from
trend expected for uncorrelated noise, while the shaded regions denote the 1σ, 2σ and 3σ confidence intervals for each particular binning calculated using 10,000 white noise draws. We note that only 75% of the white noise draws stay within the 2σ intervals for all bin sizes tested. We see that there can be a particularly large range of deviation from ![]() for large bin sizes even for actual white noise.
for large bin sizes even for actual white noise.
Current usage metrics show cumulative count of Article Views (full-text article views including HTML views, PDF and ePub downloads, according to the available data) and Abstracts Views on Vision4Press platform.
Data correspond to usage on the plateform after 2015. The current usage metrics is available 48-96 hours after online publication and is updated daily on week days.
Initial download of the metrics may take a while.