Fig. H.1
Download original image
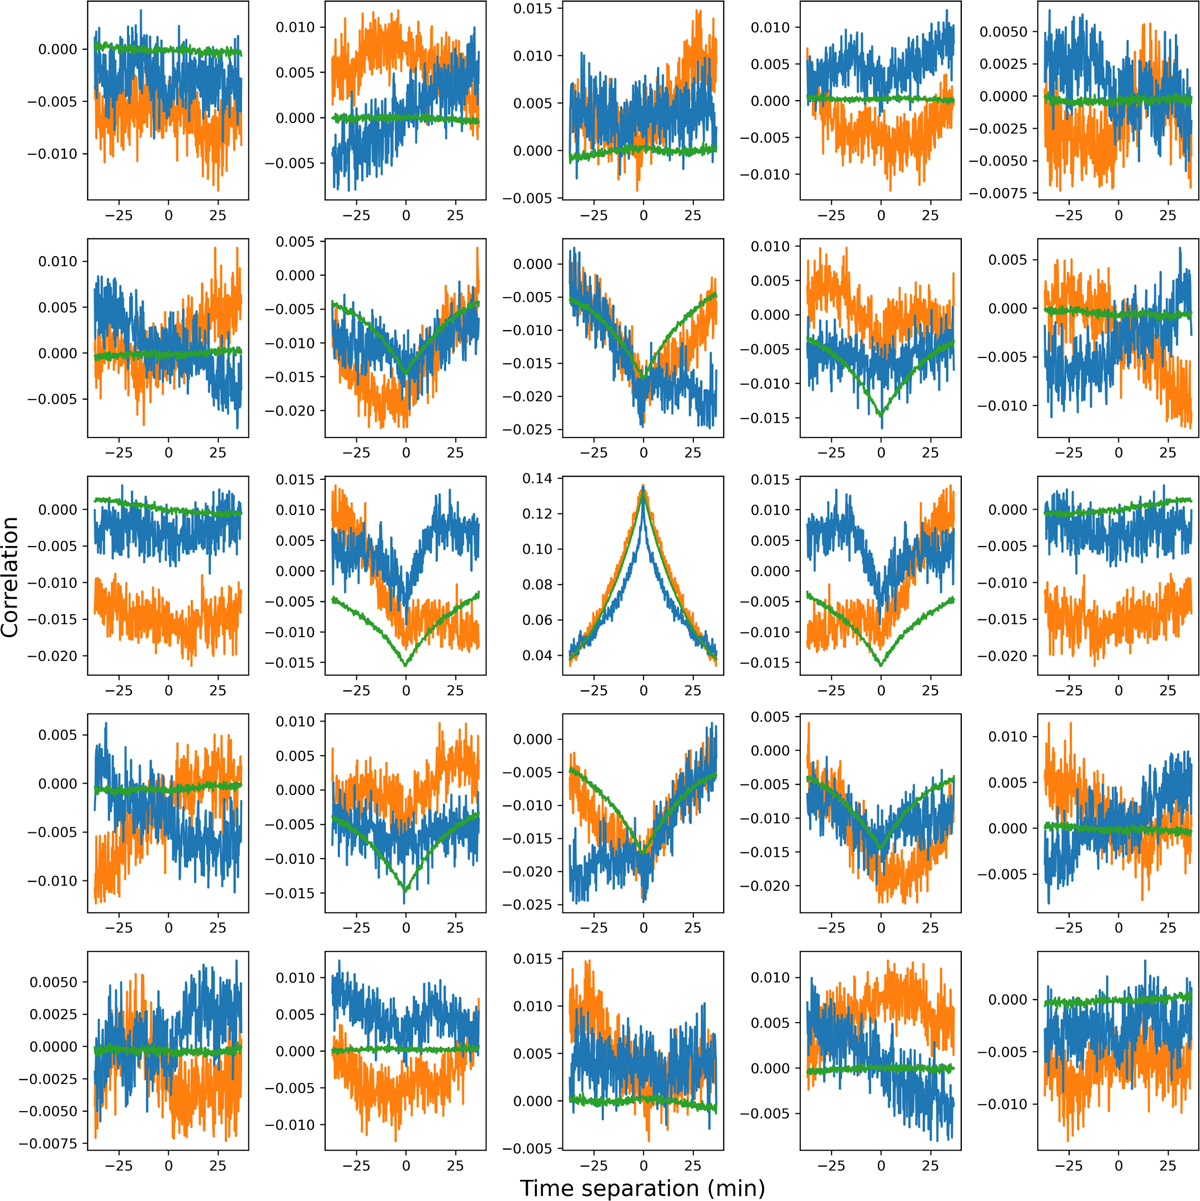
Autocorrelation of pixel light curves averaged across all the three eclipse datasets in blue, as well as autocorrelation of simulated pixel light curves for each eclipse in orange. The green is the averaged autocorrelation of 100 simulated eclipse datasets using our chosen kernel function. The autocorrelation of the real data is largely consistent with the general trend of the simulated data for three eclipses.
Current usage metrics show cumulative count of Article Views (full-text article views including HTML views, PDF and ePub downloads, according to the available data) and Abstracts Views on Vision4Press platform.
Data correspond to usage on the plateform after 2015. The current usage metrics is available 48-96 hours after online publication and is updated daily on week days.
Initial download of the metrics may take a while.