Fig. 6.
Download original image
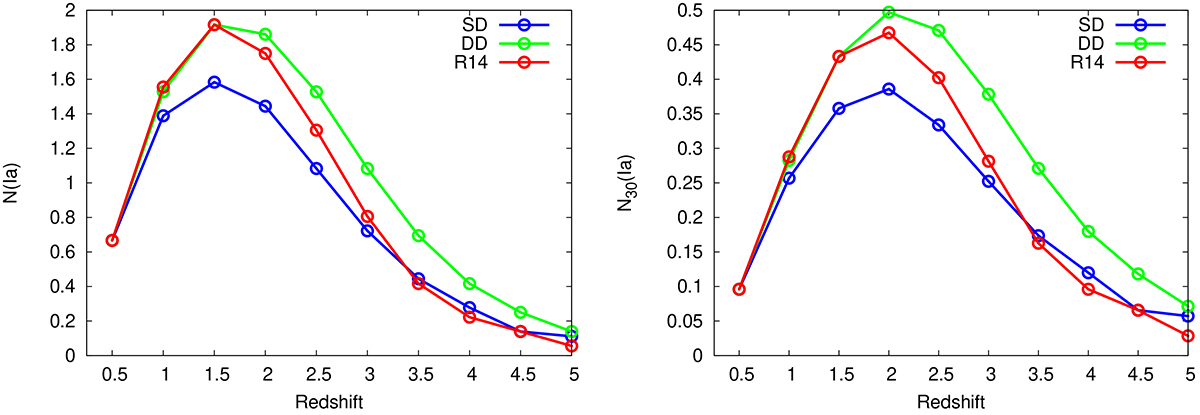
Expected number of SNe Ia as a function of redshift in the JADES survey area (∼25 arcmin2) in one year (left panel). Different DTD scenarios are shown with different colors as indicated in the legend: SD = single degenerate, DD = double degenerate, R14 = Rodney et al. (2014). The right panel shows the expected numbers assuming ∼30 days rest-frame visibility time for a SN Ia.
Current usage metrics show cumulative count of Article Views (full-text article views including HTML views, PDF and ePub downloads, according to the available data) and Abstracts Views on Vision4Press platform.
Data correspond to usage on the plateform after 2015. The current usage metrics is available 48-96 hours after online publication and is updated daily on week days.
Initial download of the metrics may take a while.