Fig. 4.
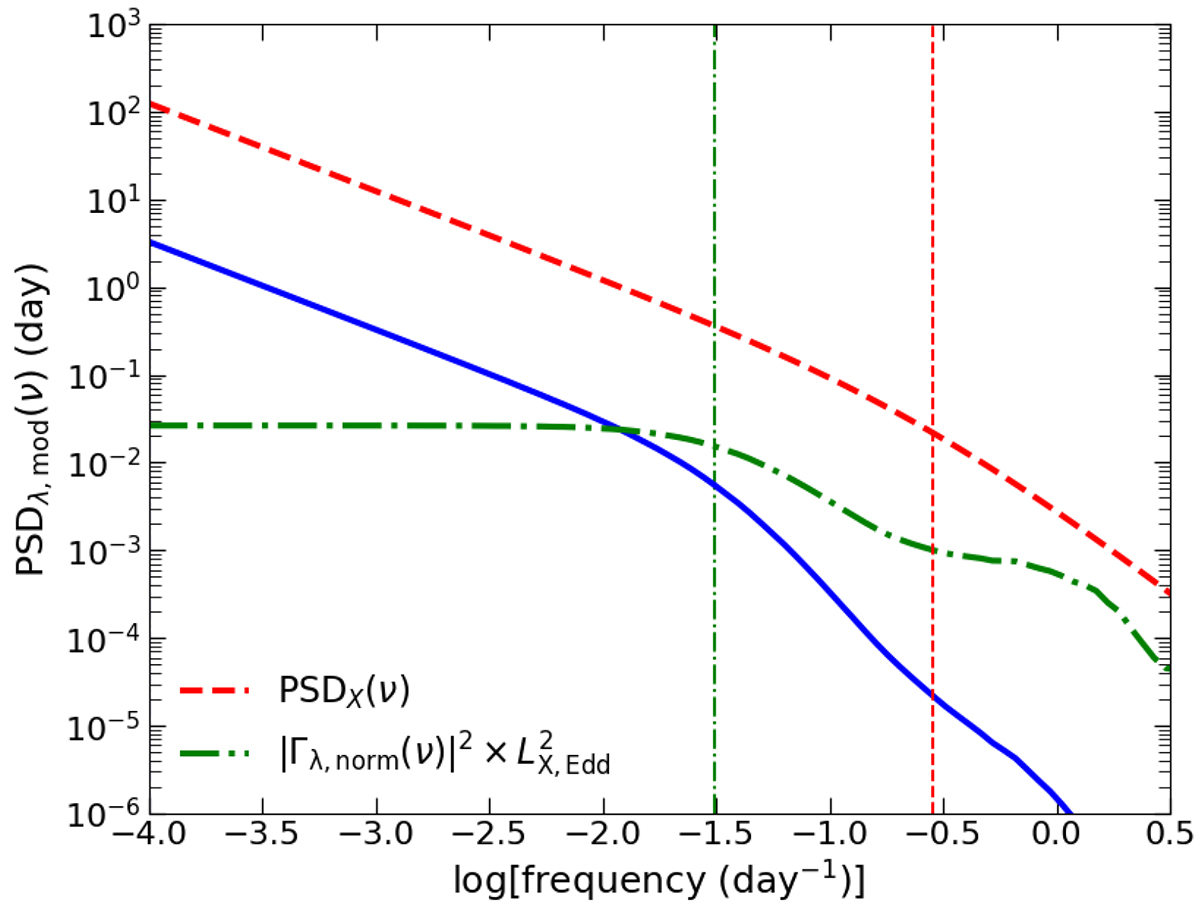
Download original image
Model power spectrum at λ = 3000 Å (solid blue line) for the parameters: MBH = 2 × 10⁸ M⊙, ṁEdd = 0.4, h = 20, Γ = 2, θ = 30°, α* = 0, Rout = 5000Rg, Ecut = 150 keV, Ltransf/Ldisc = 0.5, and fcol = 1.7. The dashed red line and the dash-dotted green lines indicate the corresponding X-ray power spectrum, PSDX(ν), and the normalised transfer function (multiplied by LX, Edd2 so that the product of the red and green line is equal to the blue line as Eq. (10) shows), respectively. The dashed red and vertical dash-dotted green lines show the position of the X-ray PSD break frequency and the transfer function break frequency, respectively.
Current usage metrics show cumulative count of Article Views (full-text article views including HTML views, PDF and ePub downloads, according to the available data) and Abstracts Views on Vision4Press platform.
Data correspond to usage on the plateform after 2015. The current usage metrics is available 48-96 hours after online publication and is updated daily on week days.
Initial download of the metrics may take a while.