Fig. 12
Download original image
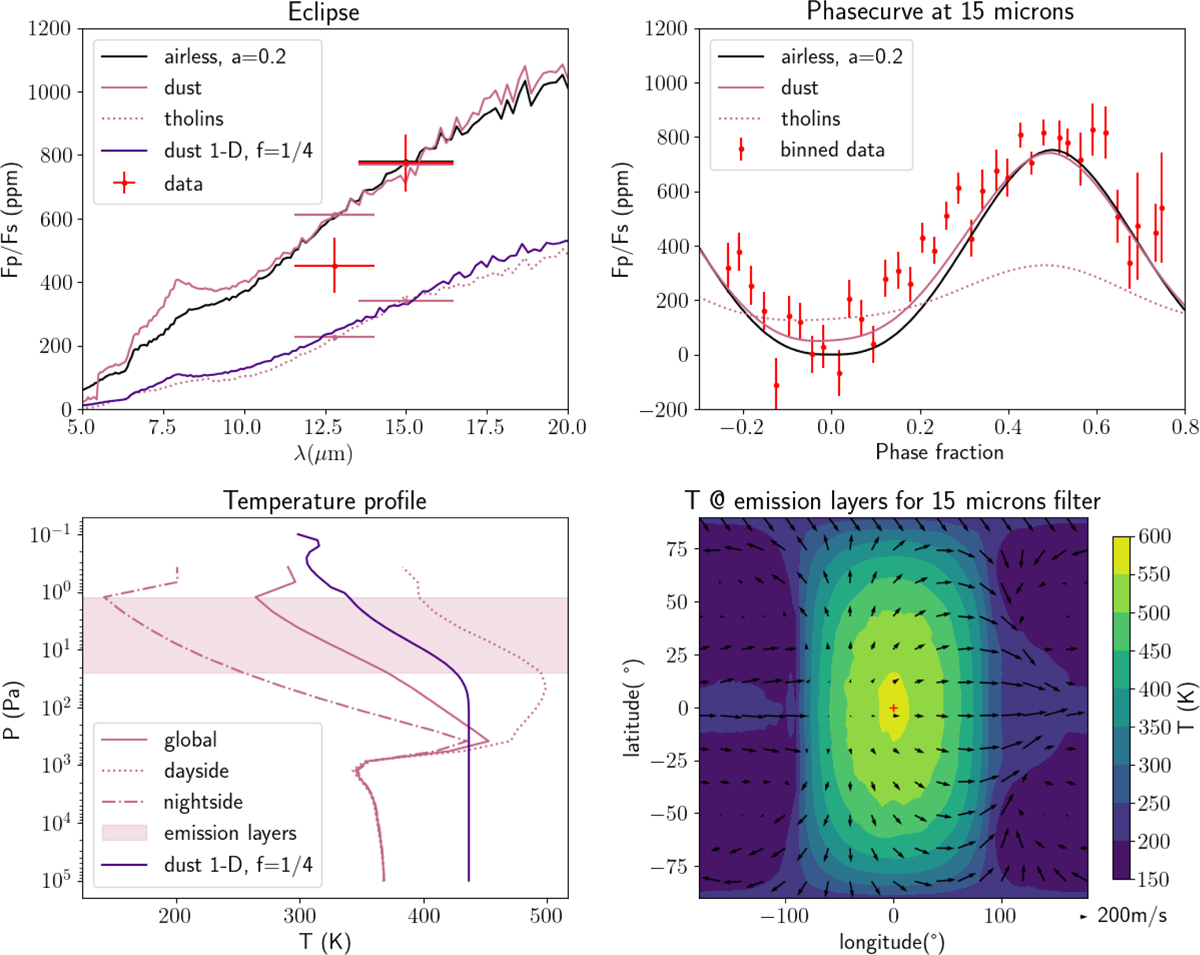
Thermal inversion: CO2+aerosols with realistic optical properties. The panels are the same as in Fig. 8. The parameters for dust and tholins are described in the text. The temperatures and winds of the lower panels correspond to the dust case, which is the model closest to the data. The difference between the 1D and 3D thermal profiles is discussed in Appendix C.2.
Current usage metrics show cumulative count of Article Views (full-text article views including HTML views, PDF and ePub downloads, according to the available data) and Abstracts Views on Vision4Press platform.
Data correspond to usage on the plateform after 2015. The current usage metrics is available 48-96 hours after online publication and is updated daily on week days.
Initial download of the metrics may take a while.