Fig. A.2
Download original image
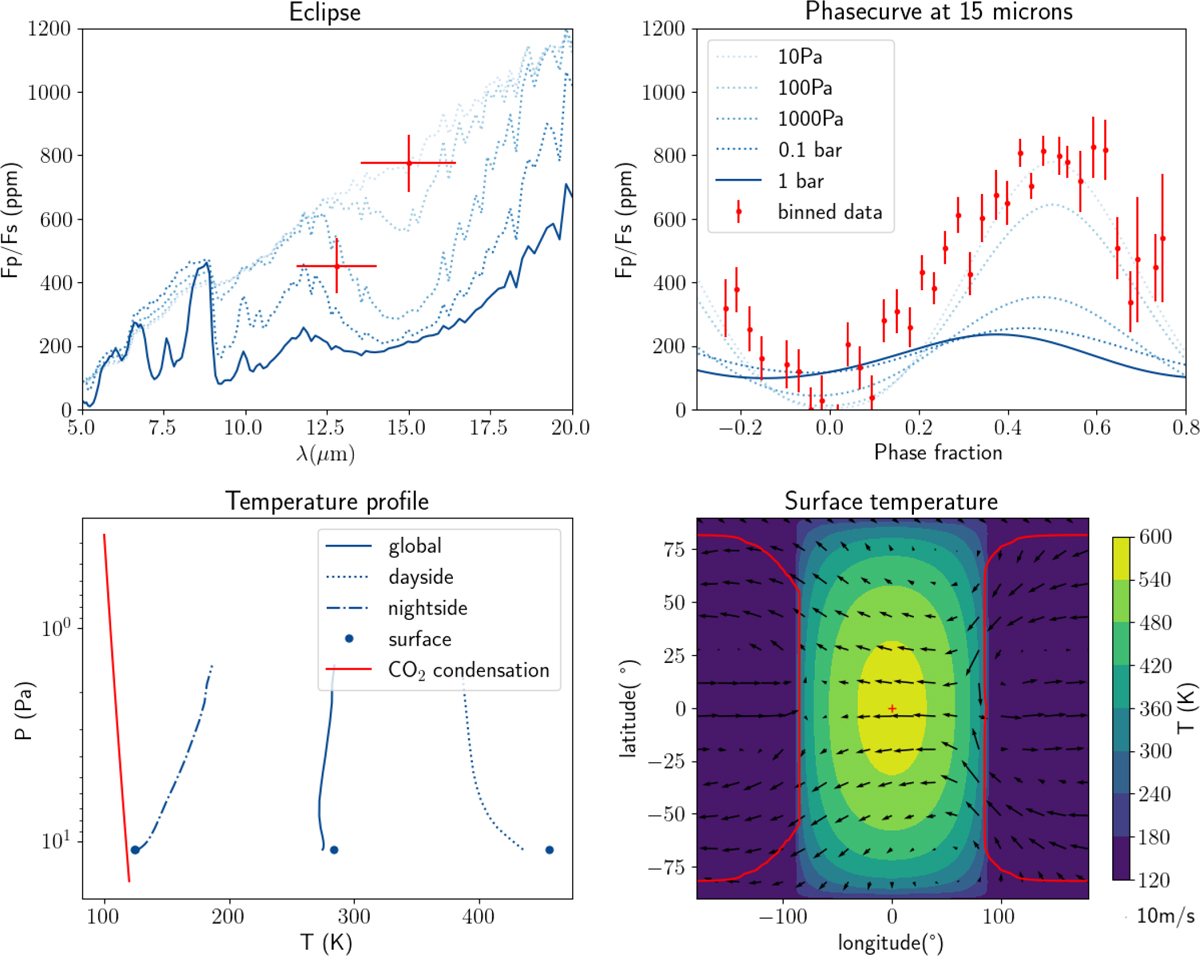
Pure CO2 case. Upper panels: Observables (right: phase curve at 15 µm, left: eclipse depth). The dotted lines represent non-stable atmospheres; these are snapshots of the atmosphere during its collapse. Lower panels: Physical quantities. Temperature profiles and temperature map for the 10 Pa case (compatible with the observations, but not stable). In the lower right panel, the red contour shows the CO2 ice caps. The red dot is the substellar point. In the lower left panel, the red line corresponds to the CO2 condensation curve.
Current usage metrics show cumulative count of Article Views (full-text article views including HTML views, PDF and ePub downloads, according to the available data) and Abstracts Views on Vision4Press platform.
Data correspond to usage on the plateform after 2015. The current usage metrics is available 48-96 hours after online publication and is updated daily on week days.
Initial download of the metrics may take a while.