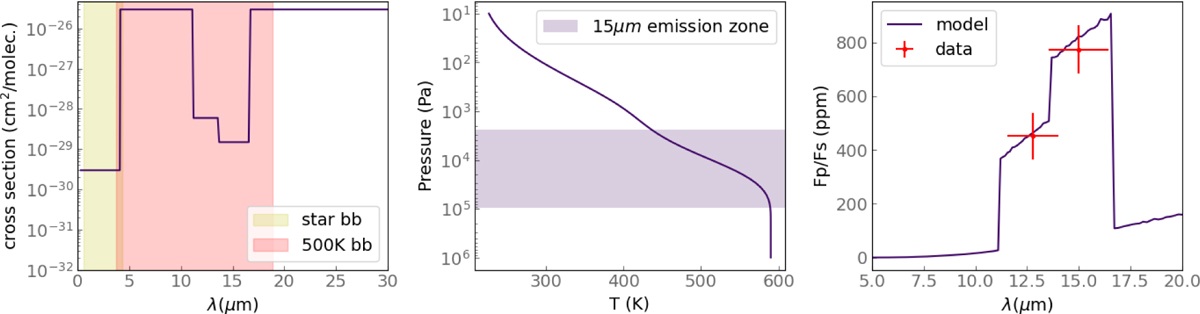
Fig. B.1
Download original image
1D study of thick atmosphere with greenhouse effect with an opacity window at the observed wavelengths. Left: Idealized opacity vs wavelength. The yellow window corresponds to the zone of emission of the star, the red window to the planet. Middle: Temperature profile. The window corresponds to the layers of 95% of the emission. Right: Corresponding eclipse depth.
Current usage metrics show cumulative count of Article Views (full-text article views including HTML views, PDF and ePub downloads, according to the available data) and Abstracts Views on Vision4Press platform.
Data correspond to usage on the plateform after 2015. The current usage metrics is available 48-96 hours after online publication and is updated daily on week days.
Initial download of the metrics may take a while.