Fig. 4
Download original image
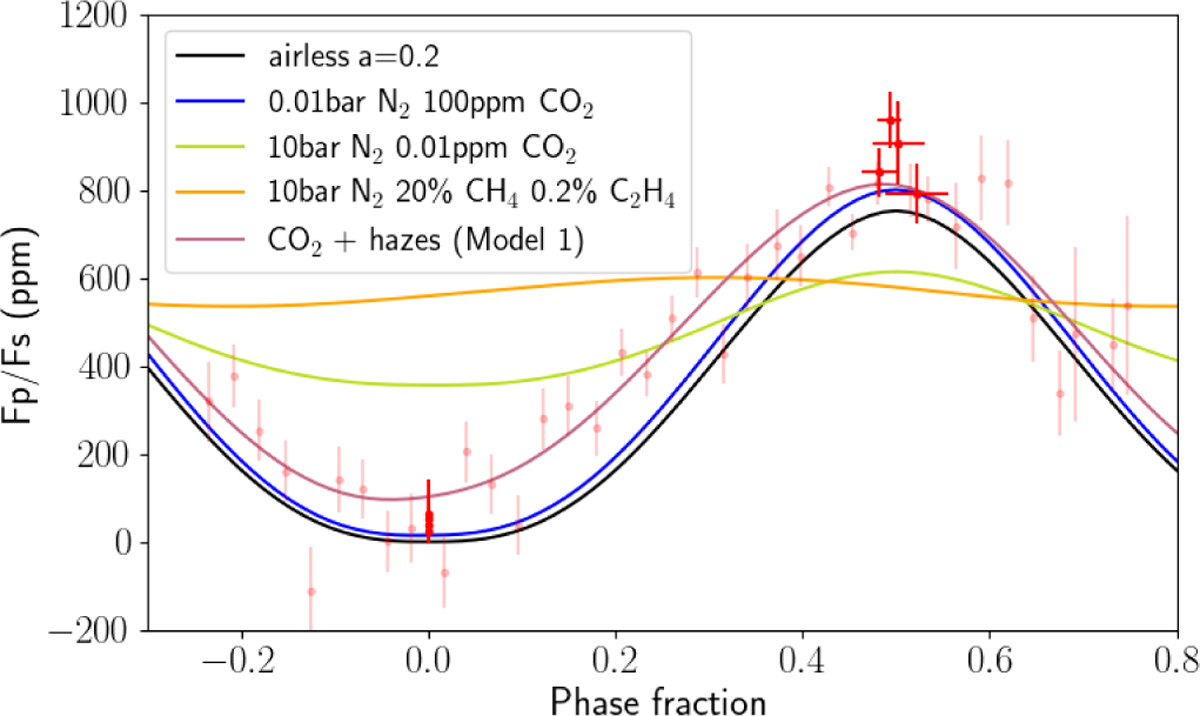
Phase curves of the simulations from Fig. 3 and data from Gillon et al. (2025). The points in transparency correspond to the binned results of one of the MCMC outputs of analysis (#1-MG) of the paper. The nontransparent points are the maximum flux, minimum flux, and peak offset with 1σ uncertainties resulting from different analyses of the paper.
Current usage metrics show cumulative count of Article Views (full-text article views including HTML views, PDF and ePub downloads, according to the available data) and Abstracts Views on Vision4Press platform.
Data correspond to usage on the plateform after 2015. The current usage metrics is available 48-96 hours after online publication and is updated daily on week days.
Initial download of the metrics may take a while.