Fig. 5
Download original image
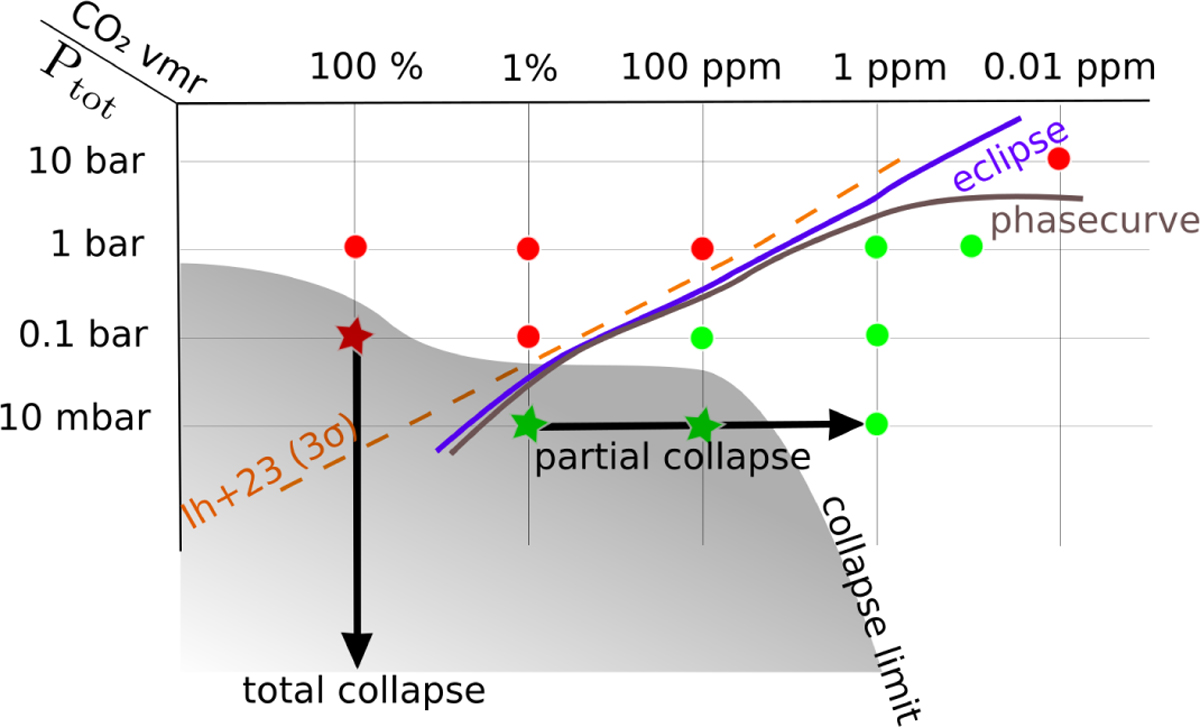
N2–CO2 grid of performed simulations. The points in red are not compatible with the observations; the green points match the data. The orange, purple, and brown lines correspond respectively to the 3σ limit of Ih et al. (2023), and limits from this work from eclipse and phase curve observations. The arrows indicate a collapse of the CO2 present in the atmosphere. The dots correspond to stable atmosphere, stars to unstable ones. The gray area indicates the atmospheres that are unstable and will collapse.
Current usage metrics show cumulative count of Article Views (full-text article views including HTML views, PDF and ePub downloads, according to the available data) and Abstracts Views on Vision4Press platform.
Data correspond to usage on the plateform after 2015. The current usage metrics is available 48-96 hours after online publication and is updated daily on week days.
Initial download of the metrics may take a while.