Fig. 8
Download original image
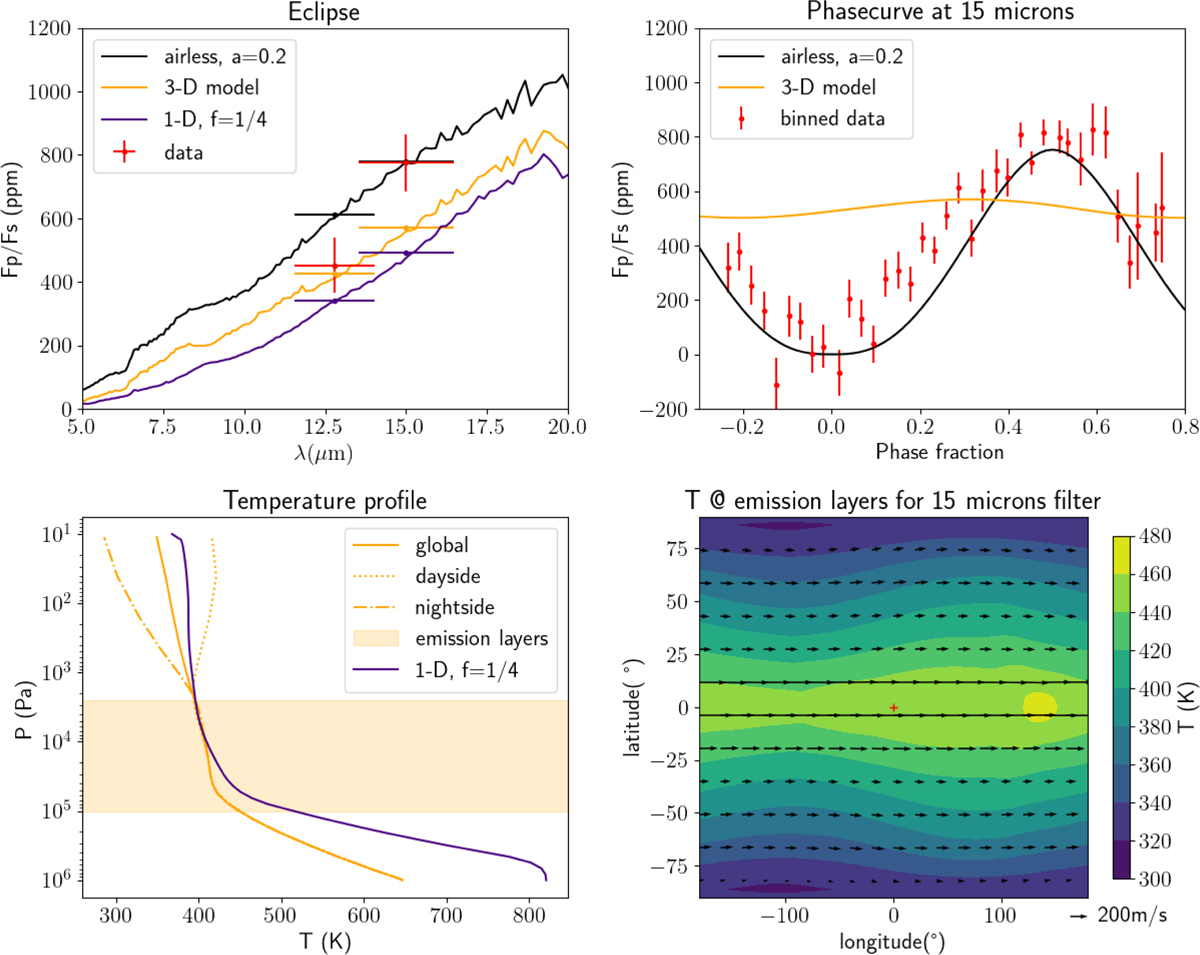
Thick atmosphere case (10 bar, N2 atmosphere with 20% of CH4 and 0.2% of C2H4). Upper panels: synthetic observables and observed data (eclipse depth vs wavelength, left, and phase curve, right). Lower panels: temperature profile (left) and map (right). The temperature map corresponds to a sum of the atmospheric layers, weighted by their contribution to the emission at 15 µm. We added the similarly weighted wind vectors as black arrows. The shadowed area in the right panel corresponds to the layers contributing to 95% of the emission. The difference between the 1D and 3D temperature profiles is discussed in Appendix B.3.
Current usage metrics show cumulative count of Article Views (full-text article views including HTML views, PDF and ePub downloads, according to the available data) and Abstracts Views on Vision4Press platform.
Data correspond to usage on the plateform after 2015. The current usage metrics is available 48-96 hours after online publication and is updated daily on week days.
Initial download of the metrics may take a while.